
Figure 3.
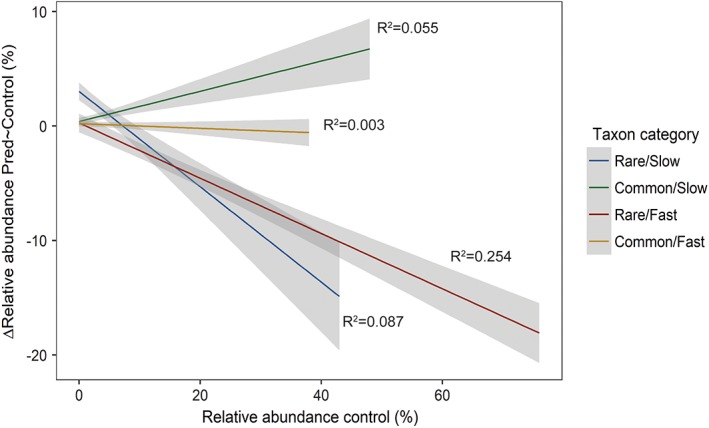
Relationship between the relative abundance in the predator free control (X‐axis) and the reduction of relative abundance with the addition of predators (Y axis) for bacterial traits belonging to the four different bacterial taxon categories. This relationship can be used as an indication of a trade‐off between competitiveness and resistance to predation; shown is a linear model fit with standard error.