
Figure 5.
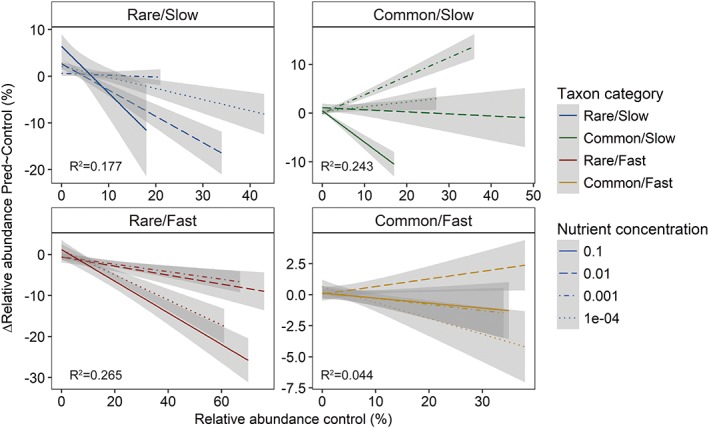
Relationship between the relative abundance in the predator free control and the reduction of relative abundance with the addition of predators at four different nutrient concentrations (indicated by different line types) and for the four taxon categories in the four panels as indication of a trade‐off between competitiveness and resistance to predation; shown is a linear model fit with standard error. R 2 values are given for each taxon category.