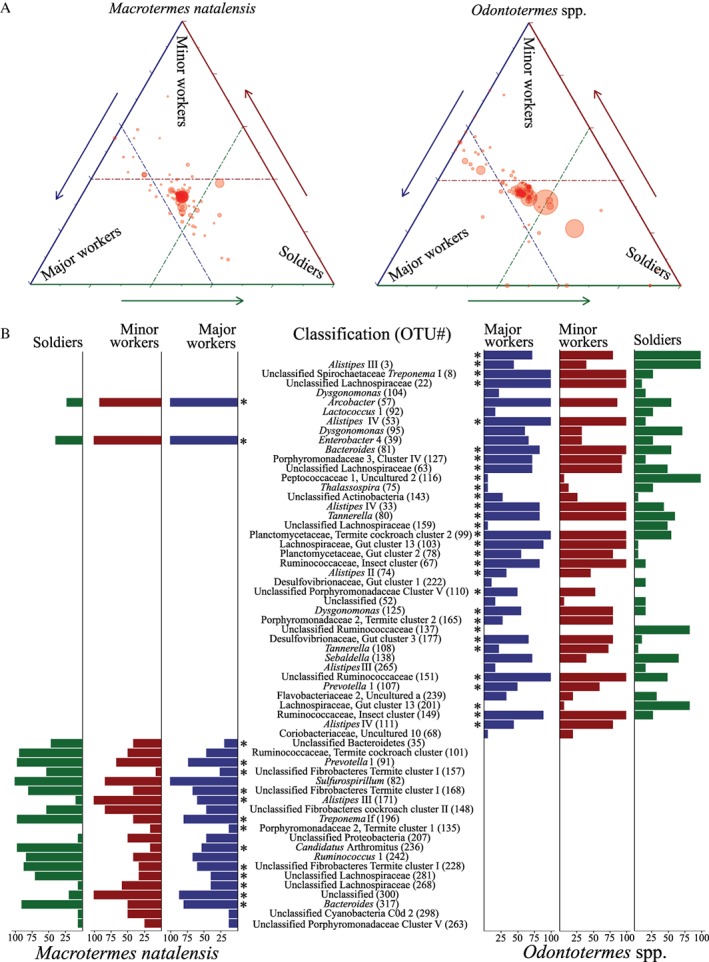
Figure 1.

Distribution and differential abundance of gut bacteria across sterile castes.
A. Ternary plot of the most abundant bacteria (> 70% relative abundances across gut communities) and their distribution between sterile castes, based on amplicon sequencing of the 16S rRNA gene (see Supporting Information for details). Each circle represents an OTU, and its size represents the relative abundance. The position of a circle represents the bacterium contribution to differentiating caste microbiota compositions, where the dashed lines represent 40% of the dissimilarity explained in the ordination analyses (based on the PCoA loading values).
B. The proportional distributions of bacterial OTUs within a caste that explain > 40% of the microbial community variations between castes in a termite genus, with the scale representing the proportion of an OTU in a caste, that is, 100 means it is present in all individuals of a given caste. OTUs significantly different in at least one pairwise DESeq2 comparison are indicated with an asterisk (for the full results, see Supporting Information Table S12).
