
Figure 2. The High Adversity group showed a heightened subjective response and a blunted physiological response.
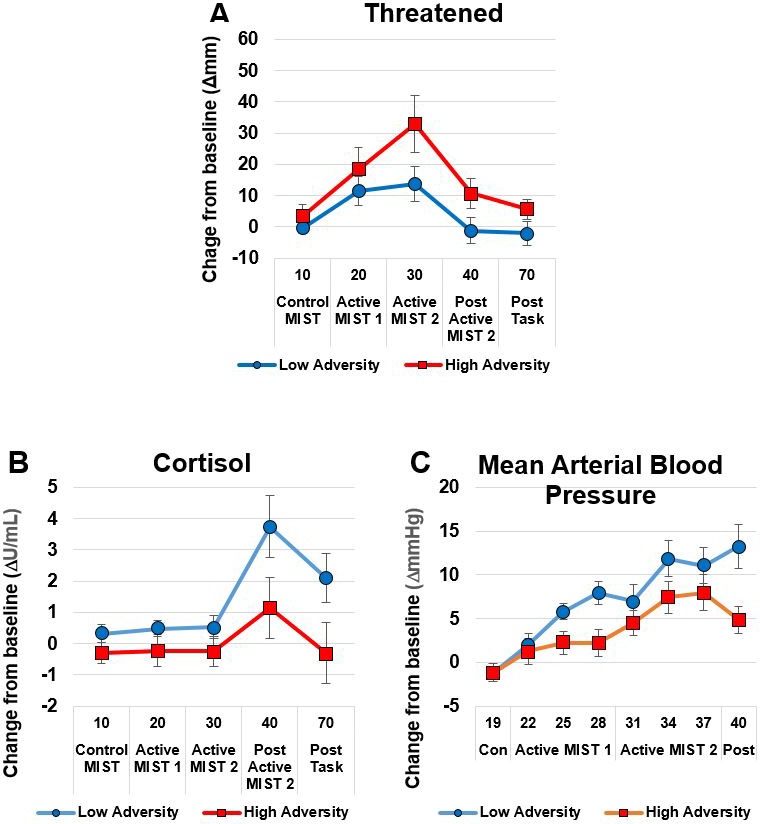
Panel A shows subjective Threatened responses; Panels B (Cortisol) and C (Mean Arterial Blood Pressure) show physiological response. Data show mean (+ /- SEM).