. 2019 Nov 12;8:e43476. doi: 10.7554/eLife.43476

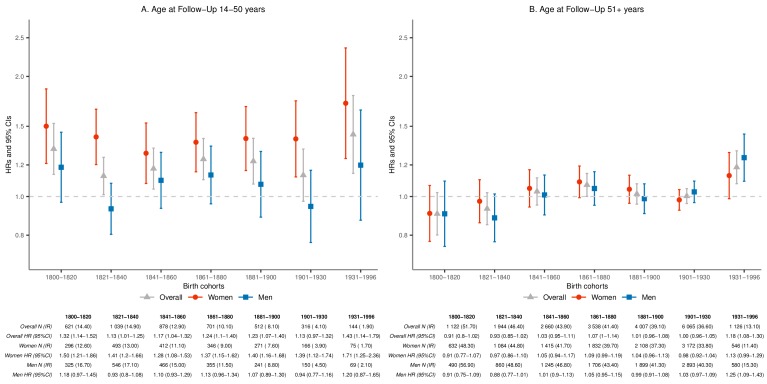
Figure 2. Hazard ratios (HRs) and 95% confidence intervals (CIs) of parental mortality after loss of a child, by age bands at follow-up (age 14–50 and 51+) and birth cohorts (every 20 years until 1900, 1901–1930, and 1931–1996), in the sibling cohort.

We stratified by sibling groups and additionally adjusted for birth year and sex in Cox proportional hazards model. IR, incidence rate, per 1000 person-years.

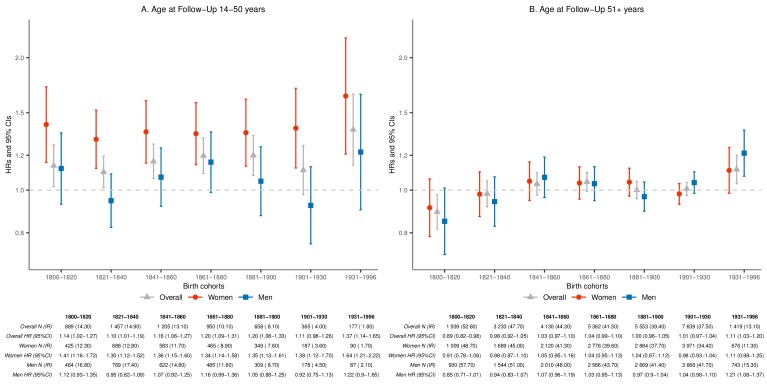
Figure 2.

Figure 2—figure supplement 1. Hazard ratios (HRs) and 95% confidence intervals (CIs) of maternal mortality after loss of a child, by age bands at follow-up, excluding mothers dying within 1 week after giving birth, in the sibling cohort.

Figure 2—figure supplement 1.

We stratified by sibling groups and additionally adjusted for birth year and sex in Cox proportional hazards model.
Figure 2—figure supplement 2. Hazard ratios (HRs) and 95% confidence intervals (CIs) of parental mortality after loss of a child among parents born during 1931–1996 and followed from age 51 onward, by age at loss, in the sibling cohort.

Figure 2—figure supplement 2.

We stratified by sibling groups and additionally adjusted for birth year and sex in Cox proportional hazards model.
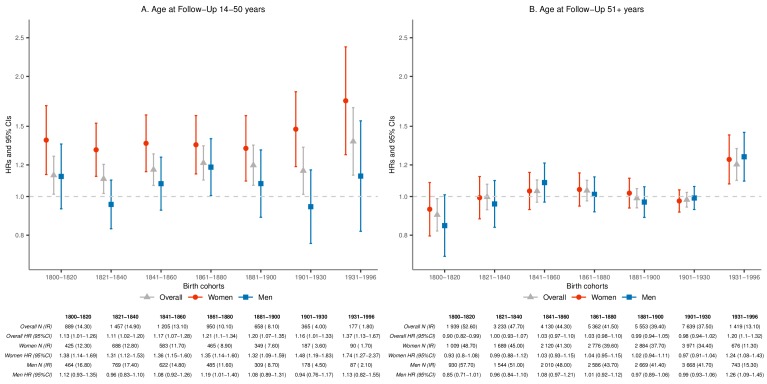
Figure 2—figure supplement 3. Hazard ratios (HRs) and 95% confidence intervals (CIs) of parental mortality after loss of a child, by age bands at follow-up (age 14–50 and 51+) and birth cohorts (every 20 years until 1900, 1901–1930, and 1931–1996), among the siblings born 5 years before or after the index parents.

Figure 2—figure supplement 3.

We stratified on sibling groups and additionally adjusted for birth year and sex in Cox proportional hazards model. IR, incidence rate, per 1000 person-years.
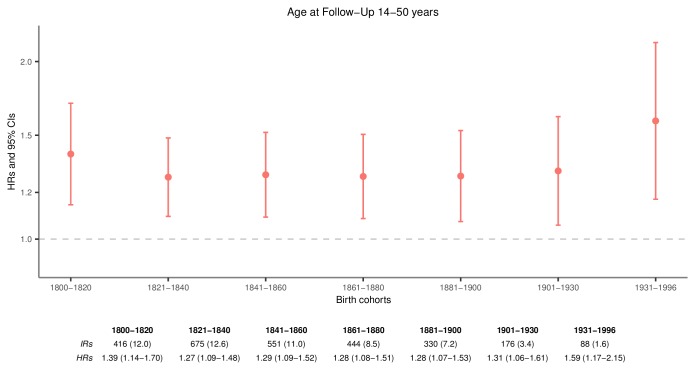
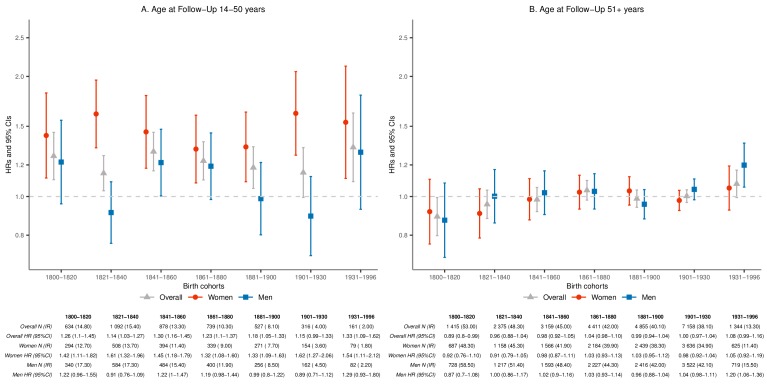
Figure 2—figure supplement 4. Hazard ratios (HRs) and 95% confidence intervals (CIs) of parental mortality after loss of a child, by age bands at follow-up (age 14–50 and 51+) and birth cohorts (every 20 years until 1900, 1901–1930, and 1931–1996), by restricting to same-sex siblings.

Figure 2—figure supplement 4.

We stratified by sibling groups and additionally adjusted for birth year and number of alive children at the matching in Cox proportional hazards model. IR, incidence rate, per 1000 person-years.
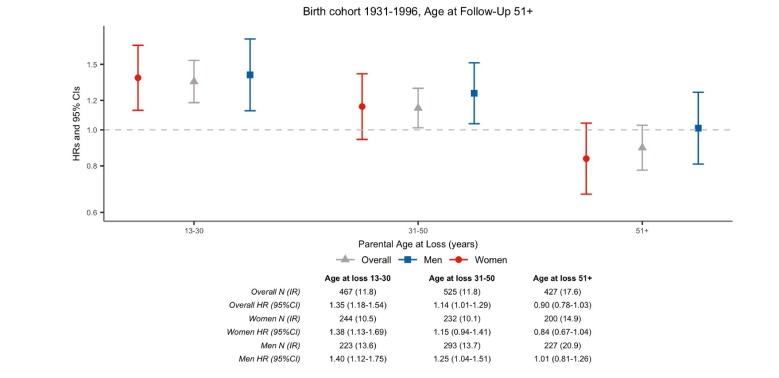
Figure 2—figure supplement 5. Hazard ratios (HRs) and 95% confidence intervals (CIs) of parental mortality after loss of a child, by age bands at follow-up (age 14–50 and 51+) and birth cohorts (every 20 years until 1900, 1901–1930, and 1931–1996), in the sibling cohort with additional adjustment for number of alive children at matching.

Figure 2—figure supplement 5.

We stratified by sibling groups and additionally adjusted for birth year, sex, and number of alive children at the matching in Cox proportional hazards model. IR, incidence rate, per 1000 person-years.
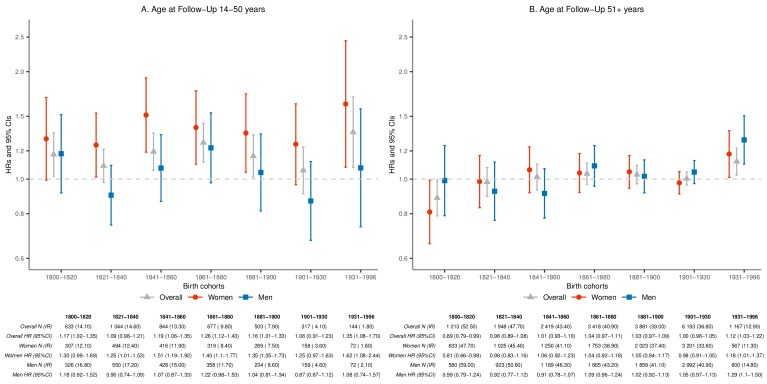
Figure 2—figure supplement 6. Hazard ratios (HRs) and 95% confidence intervals (CIs) of parental mortality after loss of a child, by age bands at follow-up (age 14–50 and 51+) and birth cohorts (every 20 years until 1900, 1901–1930, and 1931–1996), by restricting to unexposed siblings who were already parents at the same age as when the index parents lost a child.

Figure 2—figure supplement 6.

We stratified by sibling groups and additionally adjusted for birth year, sex, and number of alive children at the matching in Cox proportional hazards model. IR, incidence rate, per 1000 person-years.