. 2019 Oct 8;8:e47611. doi: 10.7554/eLife.47611

Figure 1. Behavior in new visual virtual reality (VR) environments.

(A) Head-fixed mice run to alternating ends of the VR track by controlling the movement of a floating spherical treadmill (Styrofoam ball). Mice run forward on the ball to traverse the track and rotate the ball to turn around in VR. Animals spend 7 min in a familiar environment (Fam), which is instantaneously replaced with a new environment (New) for 14 min, before returning to the same familiar environment (Fam’). The task is the same but the visual scene differs in the two environments. (B) Example mouse position in VR shows running to alternating ends of track with water rewards (green) in Fam, with worse performance in New. Lick bouts (black bars) are tracked with an electronic sensor on the lick tube. Ball speed shows similar magnitude in New and Fam environments. (C) Behavioral performance is initially impaired in New (rewards/min in New normalized to FamAve, the average performance in flanking Fam and Fam′ epochs) but improves over time. (D) Mice slow down prior to reward in the familiar environments, measured as deceleration in the 3 s window before reward. Deceleration before reward is initially lower in New but increases over days, suggesting anticipation of reward sites (N = 14 mice, *p<0.05, **p<0.01, ***p<0.001 by one-sample t-test with Bonferroni-Holm Correction (C) or paired sample t-test (D)).

Figure 1—source data 1. Statistical tests and results for Figure 1.
DOI: 10.7554/eLife.47611.005

Figure 1.

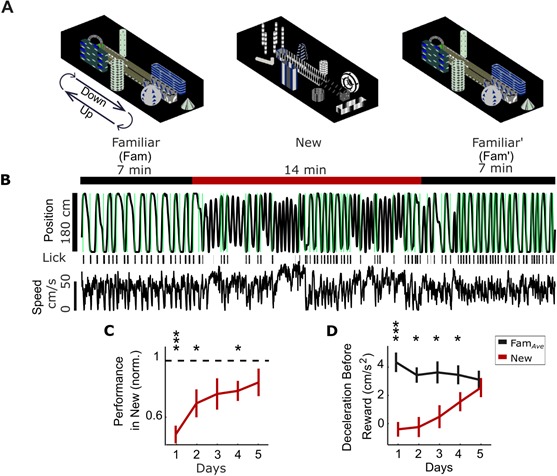
Figure 1—figure supplement 1. Behavior metrics in New world.

Figure 1—figure supplement 1.

(A) Most licks in FamAve are within a 1 s window centered on reward delivery (defined as ‘correct’ licks). The fraction of ‘correct’ licks is initially lower in New relative to Fam but increases over days. (B) The fraction of incorrect, unrewarded, entries into a track endzone which coincide with a bout of licking across five days of remapping. Mice are significantly more likely to lick in expectation of a reward upon incorrectly entering an endzone in the familiar environment (when they return to the same reward zone twice in a row), suggesting that they know the reward locations in Fam but not New. This difference decreases over the course of exposure to the New world. (C) Mice lick at lower rates in New. (D) Mean distance from endzone of missed trial, identified as the location of a premature turn in the track. Failed trials (when animals turn around too early in the track and return to the same end zone, resulting in no reward) in the New world occur further from the correct end zones than they do in the familiar environment. This difference decreases over 5 days of remapping. (E) Mice spend a similar amount of time stopped in both environments over 5 days, indicating that stopped periods do not significantly contribute to decreased behavioral performance. (F) Running speed in New across five days of remapping, normalized to mean speed in FamAve. Average running speed is the same in FamAve and New, suggesting slower running does not contribute to decreased behavioral performance. (G) Recovery of behavioral performance does not accelerate when animals undergo a second sequence of remapping into another distinct new world (New 2). Performance in New 1 (original new environment) normalized to flanking FamAve was compared to performance in New 2 (second distinct new environment) across 5 days (N = 6, a subset of animals used in other panels, p>0.99 by paired sample t-test with Bonferroni-Holm Corrections). (H) Mice were initially impaired in behavioral performance in the new environment relative to both Fam and Fam′, but the data show return to high performance in Fam′, suggesting that satiation or fatigue do not contribute to impaired behavioral performance in New. Mean performance was measured in terms of rewards per minute in the New world over 5 days of remapping. Black asterisks represent Fam vs New, Gray asterisks represent Fam′ vs New. All Fam vs Fam′ comparisons are not significantly different. (N = 14 for all panels except (G); *p<0.05, **p<0.01, ***p<0.001 by paired sample t-test or one-sample t-test with Bonferroni-Holm corrections).
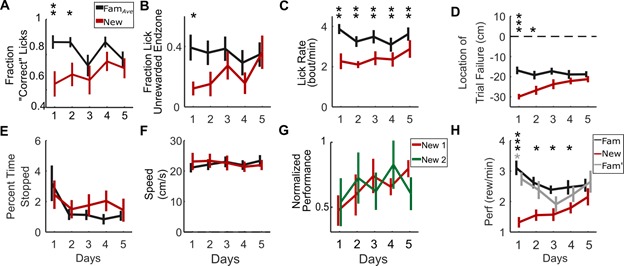
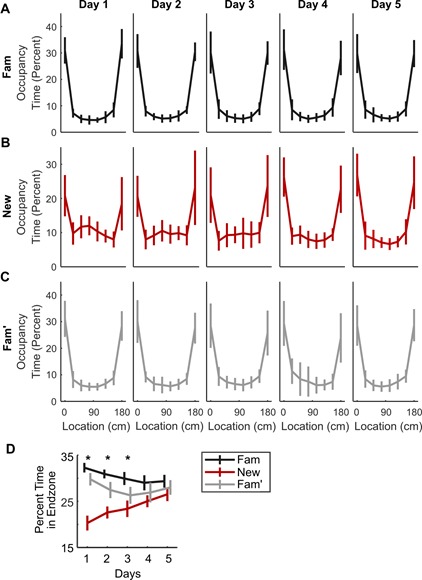
Figure 1—figure supplement 2. No track location preference in New.

Figure 1—figure supplement 2.

Occupancy time along the length of the track was used to determine whether mice developed a new preference for a region of the track in New as compared to Fam. (A) Mouse residency in Fam over 5 days. Animals spend far more time in end zones than in the middle of the track. (B) Mouse residency in New over 5 days. Animals spend more time in the middle of the track upon initial exposure to New, but still spend more time in the end zones than in the middle of the track, with no sign of preferred areas on the track. (C) Mouse residency in Fam′ over 5 days. Animals spend far more time in the end zones than in the middle of the track (paired t-test between endzones and track p<0.001 for all days, all environments). (D) Average time animals spend in the endzone in each environment over 5 days of exposure to New. (N = 14, Paired t-test between environment endzone residency, *p<0.05 paired sample t-test with Bonferroni-Holm corrections).