. 2019 Oct 8;8:e47611. doi: 10.7554/eLife.47611

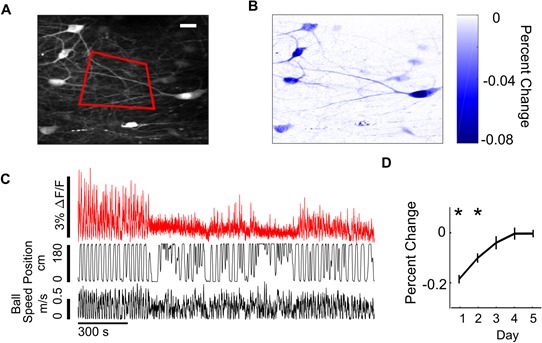
Figure 2. SOM+ interneuron (SOM-int) activity suppression in new environments.

(A–C) Example data from individual mouse (SOM 1). (A) Top, position in VR track of example mouse. Middle, ΔF/F of sample SOM-ints showing activity suppression in New. (B) Mean ΔF/F of all cells from example mouse on Day 1 of New exposure in each environment (gray), mean ΔF/F of example cells from (A) in corresponding colors, with mean of all cells (black). (C) Histogram of percent change in ΔF/F of SOM-ints shown in panel (B) in New relative to FamAve on Day 1. (D) Activity suppression in New decreases with exposure over days (cells from all mice). (E) SOM-int activity is initially suppressed but recovers over days of exposure to New. (F) Performance in New world increases over days. (G) Mice increasingly slow down prior to reward in New. (N = 10, n = 209 cells; n.s. p>0.05, *p<0.05, **p<0.01, ***p<0.001 by paired sample t-test or one-sample t-test with Bonferroni-Holm corrections).

Figure 2—source data 1. Statistical tests and results for Figure 2.
DOI: 10.7554/eLife.47611.011

Figure 2.

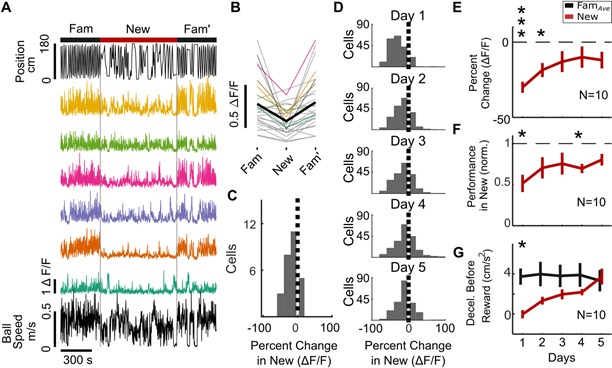
Figure 2—figure supplement 1. SOM-int activity suppression in multiple example animals.

Figure 2—figure supplement 1.

Example cell activity on a smaller time scale for four example SOM mice on Day 1 of New environment. Top, position in VR track, middle, ΔF/F of sample cells, bottom, ball speed. (A) Example cells from mouse SOM 1, seen in Figure 2. (B) Example cells from mouse SOM 2, seen in Figure 2—figure supplement 2. (C) Example cells from mouse SOM 3, not otherwise shown. (D) Example cells from mouse SOM 4, not otherwise shown.
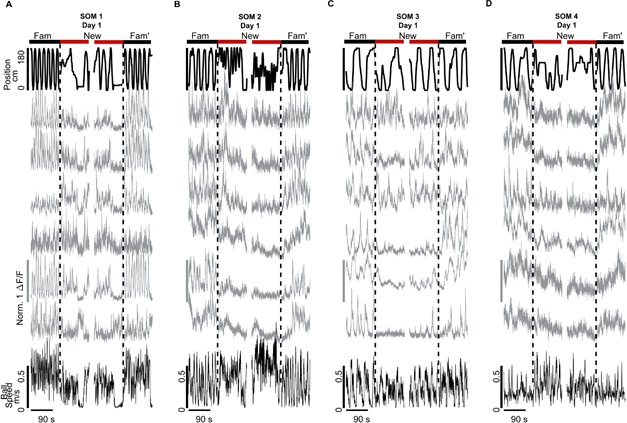
Figure 2—figure supplement 2. SOM-int activity suppression over 5 days of remapping into New.

Figure 2—figure supplement 2.

(A) Cellular activity is initially strongly suppressed but recovers over multiple exposures to New. Top, position in VR track, middle, ΔF/F of sample cells, and bottom, ball speed (SOM 2). (B) Mean ΔF/F of all cells from an example mouse on Day 1 of remapping (colors) and mean (black). (C) Histogram of percent change in ΔF/F of SOM-ints in New world relative to FamAve across 5 days of remapping. (n = 25, mouse SOM 2.)
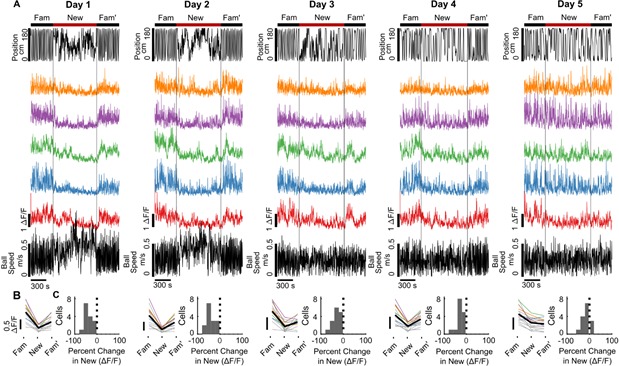
Figure 2—figure supplement 3. Broad SOM-int firing fields in Fam and New on Day 1.

Figure 2—figure supplement 3.

Data from the same sample mouse for which data are shown in Figure 2A – C (SOM 1). (A) Top, position in VR track, middle, ΔF/F of sample cells, and bottom, ball speed. (B) SOM-int firing is broadly tuned in Fam and suppressed in New. Heatmaps of neuronal activity in the VR track on Day 1 of remapping for the 27 cells in this example mouse. Cells 1–6 are the cells shown in panel (A), with the same heatmap colors.
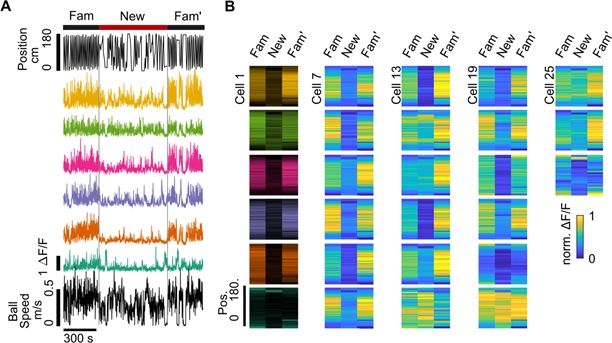
Figure 2—figure supplement 4. Suppression of SOM-int neurite activity.

Figure 2—figure supplement 4.

(A) Sample plane of imaging from SOM-ints. The red box indicates the neuropil region of interest (ROI), consisting of putative SOM-int axon and dendrites, avoiding cell somata. (B) Pixel-wise percent change in a sample plane of imaging, showing broadly distributed suppression of activity in both soma and neurites. (C) ΔF/F trace of example plane (red), shown with position (middle) and running speed (bottom). (D) Average percent change in New over 5 days of exposure (N = 10, *p<0.05 by one-sample t-test with Bonferroni-Holm correction).