. 2019 Oct 8;8:e47611. doi: 10.7554/eLife.47611

Figure 3. Decreased SOM-int activity in New is not explained by altered behavior.

(A) Gaussian general linear models (GLMs) for individual SOM-ints were trained to predict calcium activity as a function of locomotion, VR movement, and rewards in Fam. In New, modeled ΔF/F (black) is larger than actual ΔF/F (colored traces), indicating that the suppression of activity is greater than that predicted from the model (using example mouse [SOM 5]). Note that mice can move on the ball but not change their VR position, as seen here shortly after transition into New. This occurs when animals ‘run’ directly into a VR wall so that they are stationary in VR but still moving. (B) Model fits are significantly worse in New versus FamAve based on average Root Mean Square (RMS) error (lower errors mean better model fit). (C) The average amount of variance (R2) capturedby model also shows worse model fit in New (greater R2 means better model fit) (*p<0.001 by paired sample t-test Bonferroni-Holm corrections, N = 10, n = 209).

Figure 3—source data 1. Statistical tests and results for Figure 3.
DOI: 10.7554/eLife.47611.018

Figure 3.

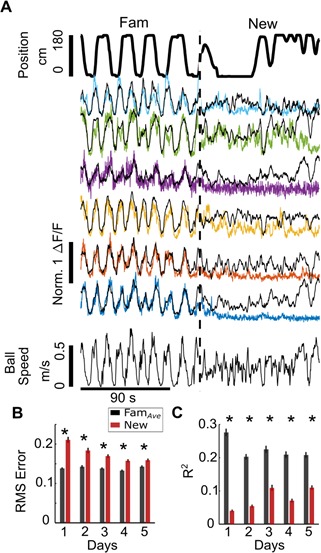
Figure 3—figure supplement 1. Behavioral variables are poorly correlated with SOM-int activity in New.

Figure 3—figure supplement 1.

Correlation between cell activity and behavioral variables in FamAve and New (measured as the peak cross-correlation within a 2 s window). Activity correlations with behavior in New are decreased initially, and recover over days of exposure to New. Forward: forward component of running speed; Rotation: rotation component of running speed; Reward: timing of rewards; Location: position in VR track; VR Speed: speed in virtual reality environment; Tot. Acc.: total acceleration from mouse running speed; For. Acc: forward component of acceleration from mouse running speed. (N = 10, n = 209, *p<0.05, by paired sample t-test with Bonferroni-Holm corrections).
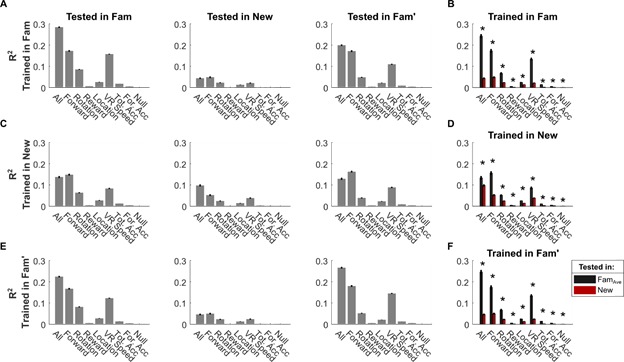
Figure 3—figure supplement 2. SOM-int GLM performance in different environments.

Figure 3—figure supplement 2.

(A) On Day 1 in New, modeled ΔF/F (black) is larger than actual ΔF/F (colored traces), while in Fam′, modeled fit improves relative to New (in example mouse (SOM 5)). (B) RMS error of model fit is significantly different in Fam versus New on all days, while New is different from Fam′ on Day 1 and 4. (C) Average R2 between modeled fluorescence and cell fluorescence across environments and days. (*p<0.05, **p<0.01, ***p<0.001 by paired sample t-test with Bonferroni-Holm corrections, N = 10, n = 209).
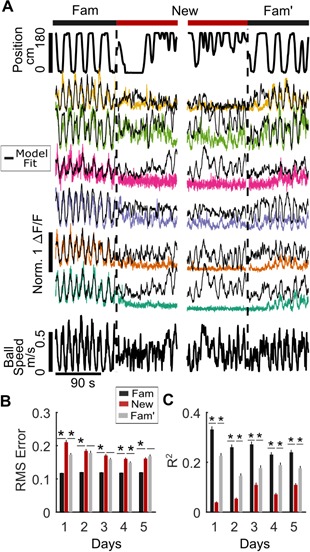
Figure 3—figure supplement 3. Locomotion variables strongly contribute to SOM-int model fits.

Figure 3—figure supplement 3.

(A) Using behavioral data at increasing possible maximum lag values for behavioral variables improves model performance. Linear models were trained on behavioral data with a varying amount of time permitted in the range used to identify the peak of the cross correlation between cell activity and behavioral parameters. Model error (root mean square) decreases with amount of lag included in the model. (B) Linear models were trained using only one of the parameters used to train the full model to examine the relative importance of different parameters to model performance. Model error (2 s lag used) is lowest when including all of the features used to train model. Relative performance of model trained on only one feature varies. For: forward component of running speed; Rot: rotation component of running speed; Rew: timing of rewards; Loc: position in VR track; VR Speed: speed in virtual reality environment; Null: constant model at mean firing rate. (C) Fraction of variance explained by model (R2) increases with amount of lag included in the model. (D) Fraction of variance (R2) explained by model (2 s lag used) is highest when including all of the features used to train the model. (N = 10, n = 209).
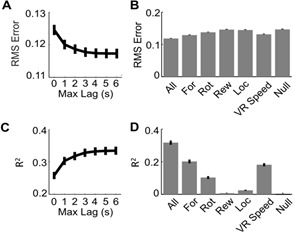
Figure 3—figure supplement 4. Behavioral variables poorly estimate SOM-int activity in New on Day 1.

Figure 3—figure supplement 4.

(A) Performance of versions of linear model (R2) trained in Fam using all behavioral variables, as well as each parameter individually, and tested in each of the three environments. Models trained in Fam accurately estimate cell activity when using locomotion variables in Fam and Fam′. Model accuracy is much worse in New. (B) Performance in FamAve and New compared for each model type. (C) Performance of models trained in New, tested in each of the three environments. Even when trained in New, the model performs poorly in New. (D) Models trained in New actually perform better in FamAve, indicating an unpredictable relationship between behavior and activity in New. (E) Performance of models trained in Fam′ using all behavioral variables, as well as each parameter individually, and tested in each of the three environments. Models trained in Fam′ perform well in Fam and Fam′, but not in New. (F) Performance in FamAve and New compared for each model type. All: model trained using all variables; Forward: forward component of running speed; Rotation: rotation component of running speed; Reward: timing of rewards; Location: position in VR track; VR Speed: speed in virtual reality environment; Tot Acc: total acceleration; For Acc: forward component of acceleration; Null: constant model at mean ΔF/F (N = 10, n = 209,*p<0.05, by paired sample t-test with Bonferroni-Holm corrections).