. 2019 Oct 8;8:e47611. doi: 10.7554/eLife.47611

Figure 4. PV+ interneuron (PV-int) activity suppression in new environments.

(A) Example data from an individual mouse (PV 1). Top, position in the VR track of an example mouse. Middle, ΔF/F of sample PV-ints showing activity suppression in New. (B) Histogram of percent change in ΔF/F of PV-ints from all mice in New relative to FamAve on Day 1, showing initial activity suppression in New that decreases with exposure over days. (C) PV-int activity is initially suppressed but recovers over days of exposure to New. (D) Performance in a New world increases over days. (E) Mice show a non-significant trend toward decreased deceleration before reward in New. (F) Gaussian general linear models (GLMs) for individual PV-ints were trained as a function of locomotion, VR movement, and rewards in Fam to predict calcium activity. In New, modeled ΔF/F (black) is larger than actual ΔF/F (colored traces), indicating that suppression of activity is greater than that predicted by the model (in example mouse (PV 2)). (G) Model fits are significantly worse in New versus FamAve based on average Root Mean Square (RMS) error (lower errors mean better model fit). (H) Average amount of variance (R2) predicted by model also shows worse model fit in New (greater R2 means better model fit) (*p<0.001 by paired sample t-test Bonferroni-Holm corrections, N = 6, n = 172).

Figure 4—source data 1. Statistical tests and results for Figure 4.
DOI: 10.7554/eLife.47611.026

Figure 4.

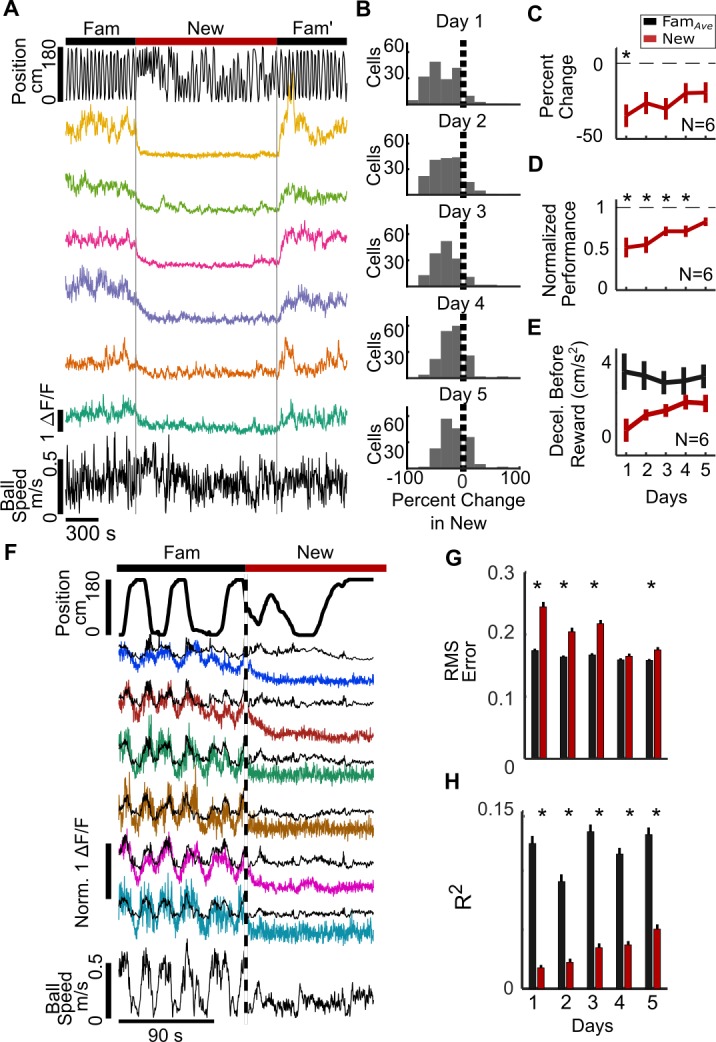
Figure 4—figure supplement 1. PV-int activity suppression over 5 days of remapping into New.

Figure 4—figure supplement 1.

(A) Cellular activity is initially strongly suppressed but recovers over multiple exposures to New in an example mouse (PV 3). Top, position in VR track, middle, ΔF/F of sample cells, and bottom, ball speed. (B) Mean ΔF/F of all cells from an example mouse on Day 1 of remapping (colors) and mean (black). (C) Histogram of percent change in ΔF/F of SOM-ints in New world relative to FamAve across 5 days of remapping (n = 46).
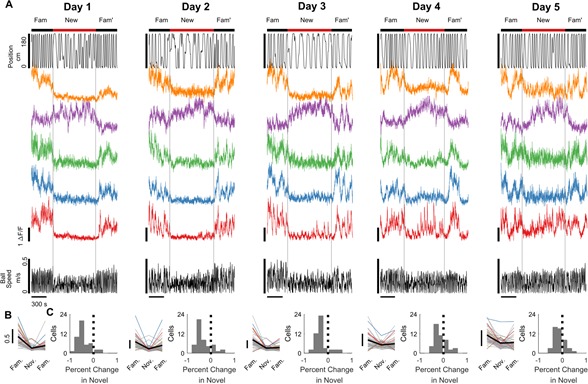
Figure 4—figure supplement 2. Broad PV-int firing fields in Fam and New on Day 1.

Figure 4—figure supplement 2.

Data from the same sample mouse as that shown in Figure 4—figure supplement 1 panels (A–C). (A) Top, position in VR track, middle, ΔF/F of sample cells (PV 1), and bottom, ball speed. (B) PV-int firing is broadly tuned in Fam and suppressed in New. Heatmaps of neuronal activity in the VR track on day 1 of remapping 28 cells from this example mouse. Cells 1–6 are the cells shown in panel (A), with the same color of heatmap.
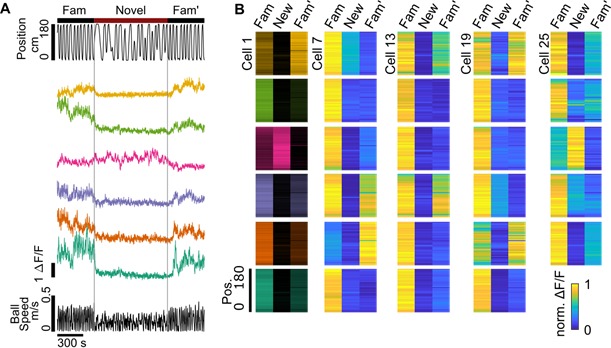
Figure 4—figure supplement 3. Suppression of PV-int neurite activity.

Figure 4—figure supplement 3.

(A) Sample plane of imaging from PV-expressing interneurons. The red box indicates the neuropil region of interest (ROI), consisting of putative PV-int axon and dendrites, avoiding cell soma. (B) Pixel-wise percent change in the sample plane of imaging, showing broadly distributed suppression of activity in both soma and neurites. (C) ΔF/F trace of example plane (red), shown with position (middle) and running speed (bottom). (D) Average percent change in New over 5 days of exposure (N = 6, *p<0.05 by one-sample t-test with Bonferroni-Holm correction).
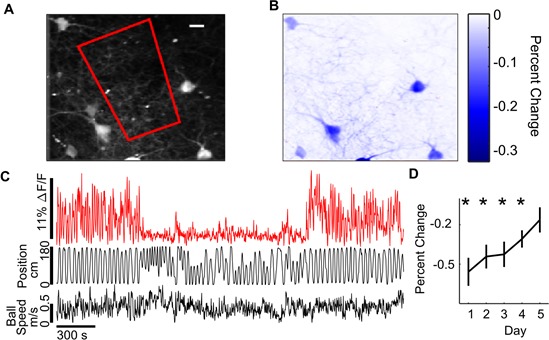
Figure 4—figure supplement 4. Behavioral variables are poorly correlated with PV-int activity in New.

Figure 4—figure supplement 4.

Correlation between PV-int activity and behavioral variables in Famave and New (measured as peak cross-correlation within a 2 s window). Activity correlations with behavior in New are decreased initially, and recover over days of exposure to New. Forward: forward component of running speed; Rotation: rotation component of running speed; Reward: timing of rewards; Location: position in VR track; VR Speed: speed in virtual reality environment; Tot. Acc: total acceleration from mouse running speed; For. Acc: forward component of acceleration from mouse running speed (N = 6, n = 172, *p<0.05, by paired sample t-test with Bonferroni-Holm corrections).
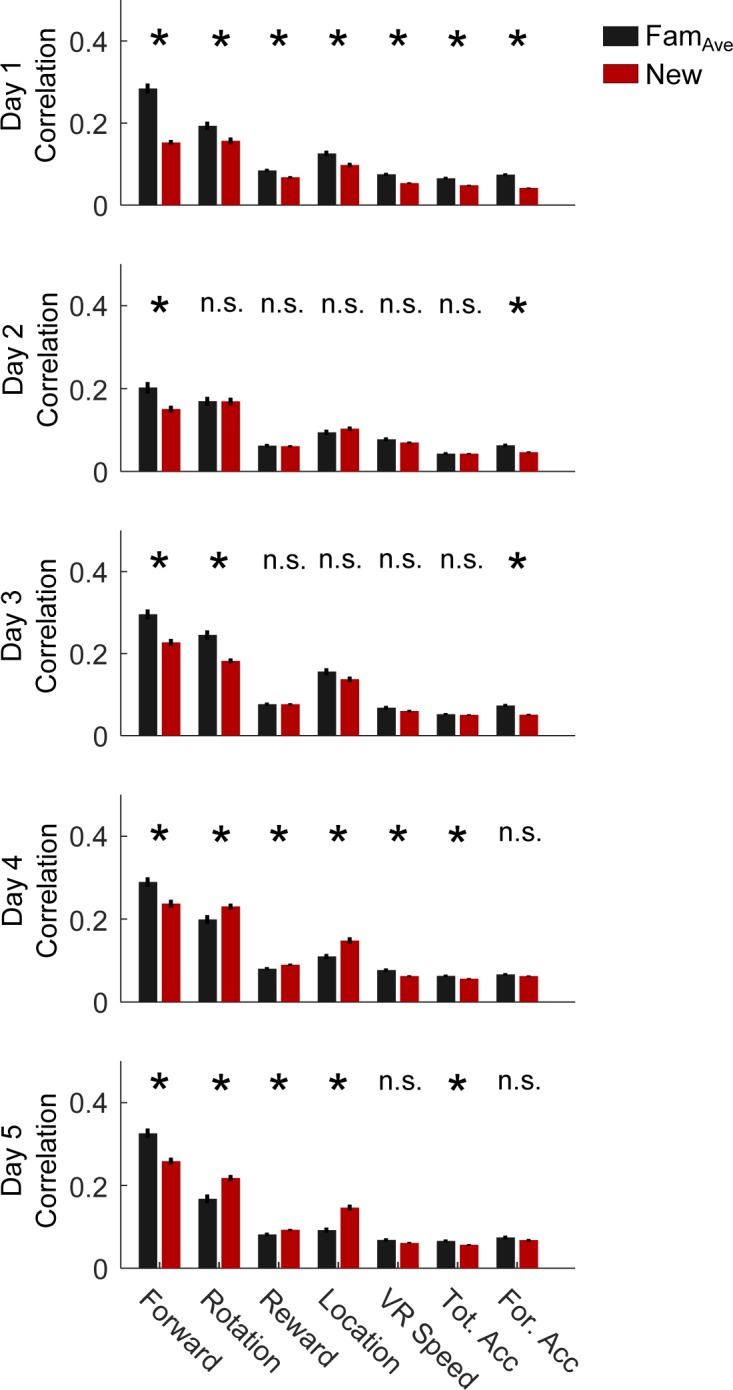
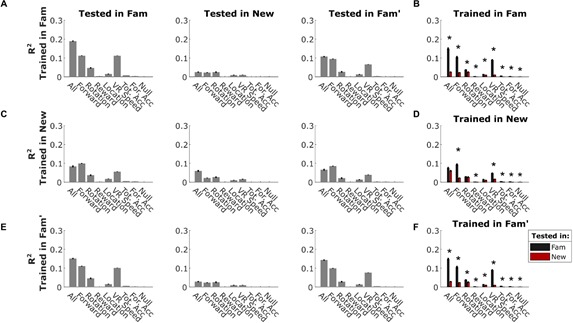
Figure 4—figure supplement 5. PV-int GLM performance in different environments.

Figure 4—figure supplement 5.

(A) RMS error of model fit is significantly different in Fam versus New on all days, while New is different from Fam′ on Days 1 and 4. (B) Average R2 between modeled fluorescence and cell fluorescence across environments and days. (*p<0.05 by paired sample t-test with Bonferroni-Holm corrections N = 6, n = 172).
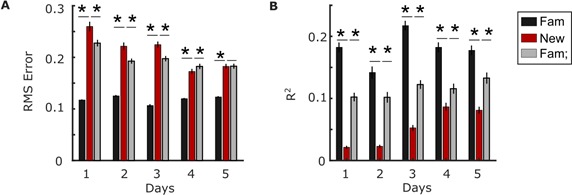
Figure 4—figure supplement 6. Behavioral variables poorly estimate PV-int activity in New on Day 1.

Figure 4—figure supplement 6.

(A) Performance of versions of linear model (R2) trained in Fam using all behavioral variables, as well as each parameter individually, and tested in each of the three environments. Models trained in Fam accurately estimate cell activity when using locomotion variables in Fam and Fam′. Model accuracy is much worse in New. (B) Performance in FamAve and New compared for each model type. (C) Performance of models (R2) trained in New, tested in each of the three environments. Even when trained in New, the model performs poorly in New. (D) Models trained in New often perform better in FamAve, indicating an unpredictable relationship between behavior and activity in New. (E) Performance of models trained in Fam′ using all behavioral variables, as well as each parameter individually, and tested in each of the three environments. Models trained in Fam′ perform well in Fam and Fam′, but not in New. (F) Performance in FamAve and New compared for each model type. All: model trained using all variables; Forward: forward component of running speed; Rotation: rotation component of running speed; Reward: timing of rewards; Location: position in VR track; VR Speed: speed in virtual reality environment; Tot Acc: total acceleration; For Acc: forward component of acceleration; Null: constant model at mean ΔF/F (N = 6, n = 172, *p<0.05, by paired sample t-test with Bonferroni-Holm corrections).