. 2019 Oct 8;8:e47611. doi: 10.7554/eLife.47611

Figure 5. SOM-int activity suppression remains high when performance recovery is blocked in a ‘No Task’ environment.

(A–C) Example data from an individual mouse (SOM 6). (A) Cells from the sample mouse are strongly suppressed during the ‘No Task’ epoch (static black screen, no rewards). Top, position in VR track, middle, ΔF/F of sample cells, and bottom, ball speed. (B) ΔF/F of all cells from an example mouse on Day 1 of ‘No Task’ exposure showing activity suppression (mean of all cells in black). (C) Histogram of percent change in ΔF/F of SOM-ints from the example mouse on Day 1 of ‘No Task’ showing strong suppression. (n = 18). (D) Interneurons remain suppressed over several days of ‘No Task’ exposure. Histogram of percent change of all cells. (E) In ‘No Task’ exposure, SOM-ints remain suppressed in contrast to recovery during exposure to New. ( The same six mice, which are a subset of the ten mice used in Figure 2E, were exposed to No Task and New). (F) Average speed in ‘No Task’ environment increases relative to Familiar, in contrast to New. (n.s. p>0.05, *p<0.05, **p<0.01, ***p<0.001 by paired sample t-test or one-sample t-test with Bonferroni-Holm corrections, N = 6, n = 116).

Figure 5—source data 1. Statistical tests and results for Figure 5.
DOI: 10.7554/eLife.47611.030

Figure 5.

Figure 5—figure supplement 1. SOM-int activity suppression in the No Task environment.

Figure 5—figure supplement 1.

Cellular activity remains strongly suppressed over multiple exposures to the No Task environment. (A) Top, position in VR track, middle, ΔF/F of sample cells (SOM 7), and bottom, ball speed. (B) Mean ΔF/F of all cells from an example mouse on Day 1 of the No Task environment. (C) Histogram of percent change in ΔF/F of SOM-ints in No Task relative to FamAve environments across 5 days of exposure. (n = 24).
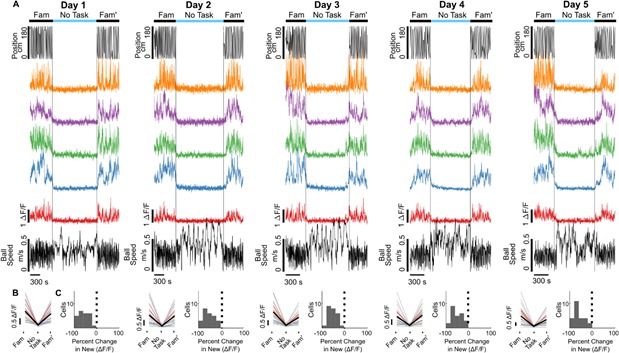
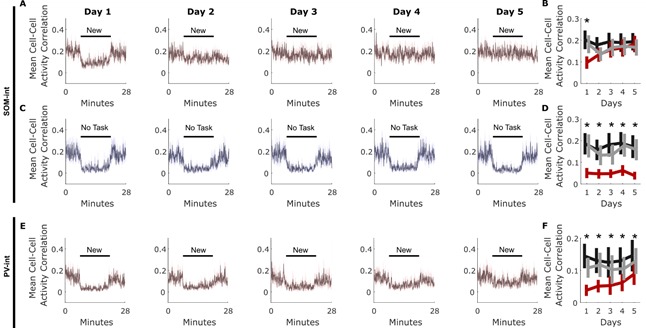
Figure 5—figure supplement 2. Short-time correlation declines in new environments.

Figure 5—figure supplement 2.

Short-time correlation, measured as the overall mean of all pairwise activity correlations within a time bin, decreases in new environments. (A) SOM-int short-time (5 s non-overlapping bins) cell-cell activity correlation across time for each of 5 days of exposure to New. (B) SOM-int mean activity correlation decrease during New in comparison to Fam on the first day. (C) SOM-int short-time cell-cell correlation across time for each of 5 days of exposure to No Task. (D) SOM-int mean activity correlation decreased on all days in No Task compared to Fam. (E) PV-int short-time cell-cell activity correlation across time for each of 5 days of exposure to New. F, PV-int mean activity correlation decreased on all days in Ne compared to Fam. (SOM-int: New, N = 10; No Task, N = 6; PV-int: New, N = 6; *p<0.05 comparing either Fam and New, or Fam and No Task, by paired sample t-test with Bonferroni-Holm corrections).