. 2019 Oct 8;8:e47611. doi: 10.7554/eLife.47611

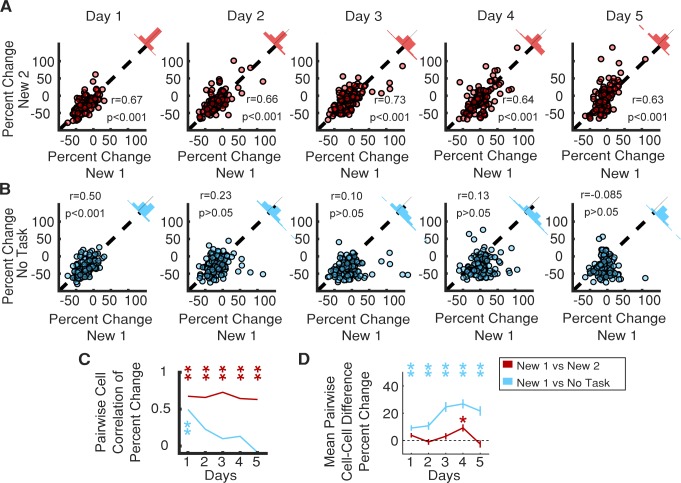
Figure 6. Consistent SOM-int activity responses across different new environments and in ‘No Task’ epoch.

(A) Individual SOM-ints show correlation in activity modulation in two distinct New environments. (B) Similar correlation of activity modulation is seen between New 1 and ‘No Task’ exposures for Day 1. On subsequent days, correlation disappears as SOM-int activity begins to return in New 1 while remaining suppressed in ‘No Task’. (C) Summary of correlation data from (A) and (B). Correlation between percent change of cells between two remapping sessions or between remapping session one and the ‘No Task’ exposure session. (D) Mean difference in percent change in activity in cells between remapping and ‘No Task’ exposure settings (*p<0.01, **p<0.001, one-sample t-test with Bonferroni-Holm correction N = 6, n = 116).

Figure 6—source data 1. Statistical tests and results for Figure 6.
DOI: 10.7554/eLife.47611.035

Figure 6.

Figure 6—figure supplement 1. Characterization of suppressed SOM-ints.
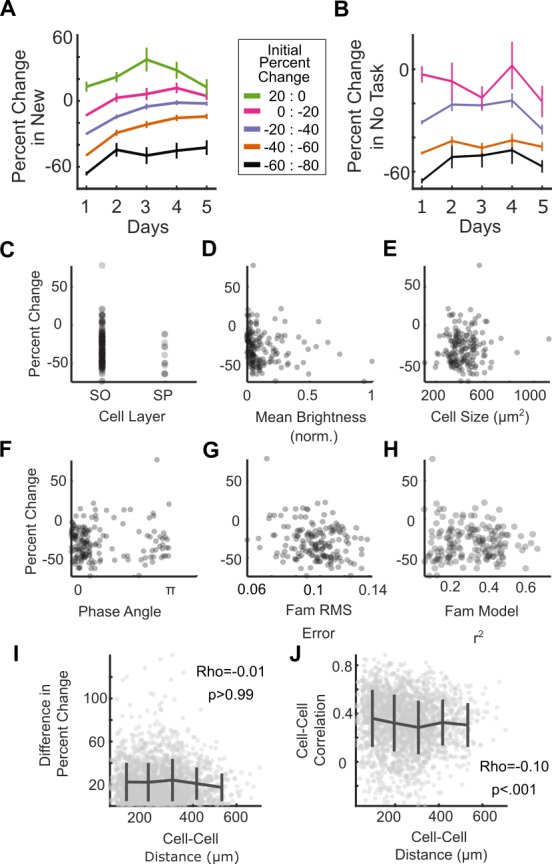
Figure 6—figure supplement 1.

(A) SOM-ints most inhibited on Day 1 in New remain the most suppressed over the course of the experiment. Percent change in activity in New relative to FamAve, across 5 days, stratified by degree of suppression on Day 1. (B) Percent change in activity in ‘No Task’ session, stratified by degree of suppression on Day 1. (C) Soma location was not associated with activity suppression in New. Percent change of activity on Day 1 in New based on soma location, either stratum oriens (SO) or stratum pyramidale (SP). Most SOM-expressing bistratified interneurons have somas in SP, whereas most Oriens-lacunosum moleculare (OLM) interneurons have somas in SO. (D) Mean cell brightness was not associated with activity suppression in New. Percent change of activity on Day 1 in New versus mean cell brightness. (E) Soma cell size was not associated with activity suppression in New. Percent change of activity on Day 1 of New versus cell size. (F) SOM-int activity correlation with locomotion was not associated with activity suppression in New. Percent change of activity on Day 1 in New versus phase angle of the Hilbert transform for the correlation between stop-triggered mean activity and running speed for each cell. Cells with a positive activity correlation with locomotion have a phase angle near 0, whereas those that are anti-correlated (activated by immobility) are shifted ~180° or π radians. (G) GLM model fit was not associated with activity suppression in New. Percent change of activity on Day 1 in New versus RMS error of model fit to actual cellular ΔF/F in Fam. (H) Percent change of activity on Day 1 in New versus R2 of model fit to actual cellular ΔF/F in Fam. (I) There is no association between cell proximity and strength of response to New (p>0.99). (J) Closer cells have more correlated activity (Spearman Rho −0.1, p<0.001). (A–H: N = 10, n = 209. A, B: vertical bars are binned mean with s.e.m., horizonal is connecting line. I, J: N = 10, n = 1793 cell pairs, vertical bars are binned mean with s.d., horizonal is connecting line.)
Figure 6—figure supplement 2. SOM-int network activity structure is stable across environments.
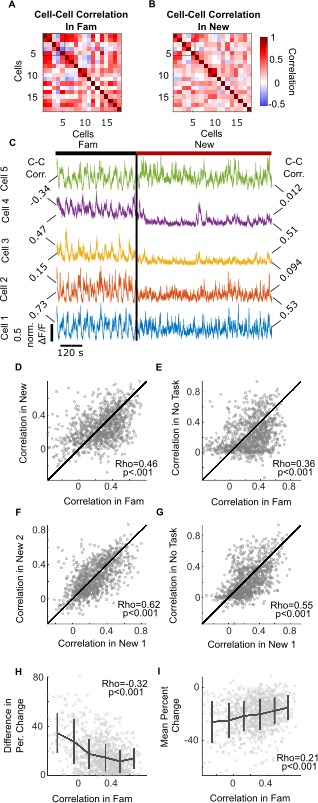
Figure 6—figure supplement 2.

(A) Correlation matrix of pairwise comparisons of SOM-int ΔF/F of cells from a single imaging plane in Fam. The color of each square represents the Pearson correlation between cell-activity traces. (B) Correlation matrix for same cells in a subsequent New epoch. Cell-cell activity relationships are generally maintained, although the magnitude of activity correlation changes in New. (C) Colored traces, ΔF/F of cells 1–5 from panels (A) and (B) at the transition from Fam to New. Cell-cell correlation values between traces are shown to the left for Fam epoch and to the right for New. Cell pairs have similar activity correlation in Fam and New. (D) Scatter plot of cell pair activity correlation in New vs. Fam. (E) Scatter plot of cell pair activity correlation in No Task vs. Fam. (F) Scatter plot of cell pair activity correlation in New1 vs. New2. (G) Scatter plot of each pair activity correlation in No Task vs. New. (H) Scatter plot of cell pair activity correlation vs. absolute difference in percent change in activity in New between each cell pair. Cell pairs with more dissimilar activity in Fam show larger differences in activity suppression in New. (I) Scatter plot of cell pair activity correlation vs. mean percent change of activity in New for each cell pair. (N = 6, n = 1036 cell pairs. In panels (D–E), the line is unity, tests are Spearman Rank Correlation. In (H, I), vertical bars are binned mean with s.d.; Spearman rho).
Figure 6—figure supplement 3. SOM-int network activity structure is stable across days in the same environment.
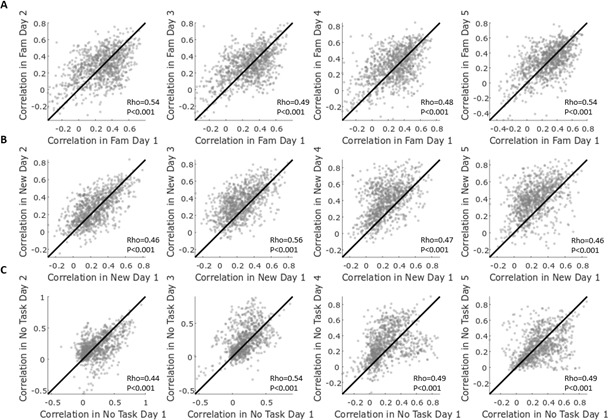
Figure 6—figure supplement 3.

(A) Scatter plot of cell pair activity correlation in Fam across 5 days. (B) Scatter plot of cell pair activity correlation in New across 5 days. (C) Scatter plot of cell pair activity correlation in No Task across 5 days. (N = 6, n = 1036 cell pairs, line is unity, test by Spearman Rank Correlation).