
Figure 2. Mboat7 knockdown promotes hepatic steatosis and worsen liver injury.
(A and B) C57BL/6 mice were fed chow or HFD with concurrent Control and Mboat7 ASO Injections at 12.5 mg/kg week for 20 weeks. Liver Mboat7 expression was measured via qPCR (A); n = 8–10; *p≤0.05, ****p≤0.0001; Two-way ANOVA with Tukey’s post-hoc test). The inset show a representative Western blot for hepatic MBOAT7 protein levels, which was replicated in n = 4 mice. (B) Body weight was measured weekly. (C) Food intake was measured in C57BL/6 mice at 12 weeks of diet and ASO injections (n = 6). (D) Oxygen consumption was measured by indirect calorimetry in C57BL/6 mice after 12 weeks of diet and ASO injections (n = 6). (E) Representative liver hematoxylin and eosin stained sections. 20x magnification. (F) Liver-to-body weight measurements from mice fed Chow and HFD with Control and Mboat7 ASO Injections for 20 weeks (n = 8–10; ****p≤0.0001; Two-way ANOVA with Tukey’s post-hoc test). (G and H) Plasma ALT (G) and AST (H) levels were measured after 20 weeks of diet feeding and ASO injections (n = 8–10; ****p≤0.0001; Two-way ANOVA with Tukey’s post-hoc test). (I) Percent steatosis quantified by a blinded board certified pathologist at the Cleveland Clinic (n = 3; ****p≤0.0001; Two-way ANOVA with Tukey’s post-hoc test). (J–M) Hepatic triglycerides (J), hepatic cholesterol (K), hepatic esterified cholesterol (L), and hepatic free cholesterol (M) were measured colorimetrically (n = 8–10; **p≤0.01, ***p≤0.001, ****p≤0.0001; Two-way ANOVA with Tukey’s post-hoc test). All data are presented as mean ± S.E.M., unless otherwise noted.

Figure 2—figure supplement 1. Mboat7 ASO treatment reduces Mboat7 expression in white adipose tissue (WAT), but does not dramatically alter WAT gene expression or adiposity.

Figure 2—figure supplement 2. Mboat7 ASO treatment does not alter Mboat7 expression in several extrahepatic tissues.
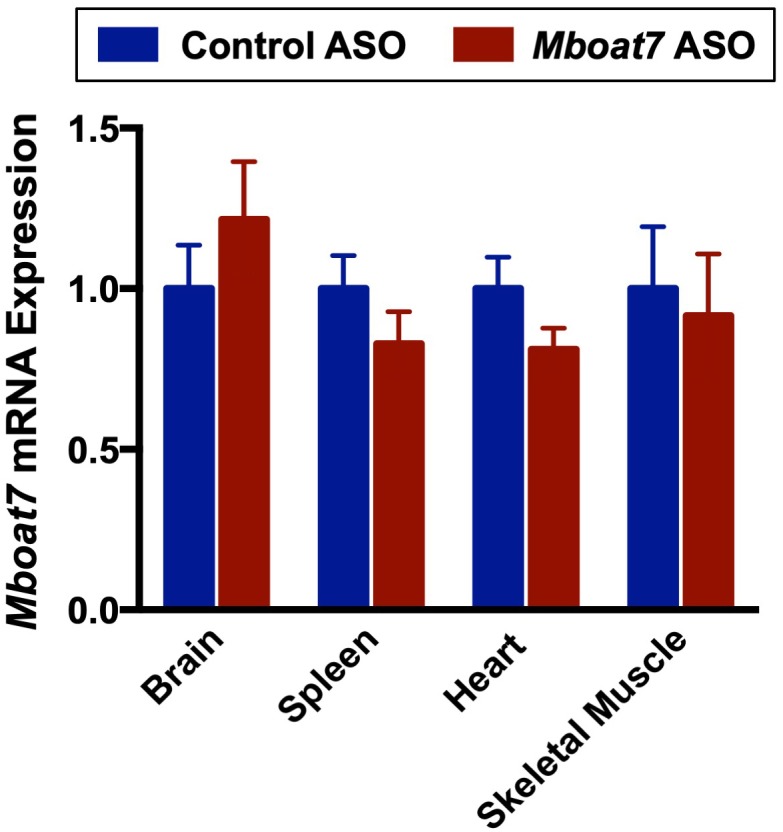
Figure 2—figure supplement 3. A reduction in hepatic MBOAT7 expression does not alter metabolic parameters.

Figure 2—figure supplement 4. Hepatic steatosis is observed in two distinct ASOs targeting different regions of the Mboat7 mRNA.

Figure 2—figure supplement 5. Knockdown of Mboat7 alters plasma lipid levels in chow but not HFD-fed mice.
