
Figure 8. Lysophosphatidylinositol (LPI) lipids stimulate pro-inflammatory and pro-fibrotic gene expression in a Mboat7-dependent manner.
Male C57BL/6 mice were treated with either a non-targeting control ASO or Mboat7 ASO while being fed a high fat diet for 11 weeks. Thereafter, mice were injected IP with saline (vehicle) or 12.5 μg of the Mboat7 substrate lipids 16:0 or 18:1 LPI (2 injections at 7 am and seven pm), and liver was collected 12 hr later. (A–H) Liver mRNA levels were measured by qPCR. (I) Liver triacylglycerol (TG) levels. Data are presented as mean ± S.E.M. (n = 5; *p≤0.05).

Figure 8—figure supplement 1. Accumulation of LPI species elevate after 4 hr post-injection.
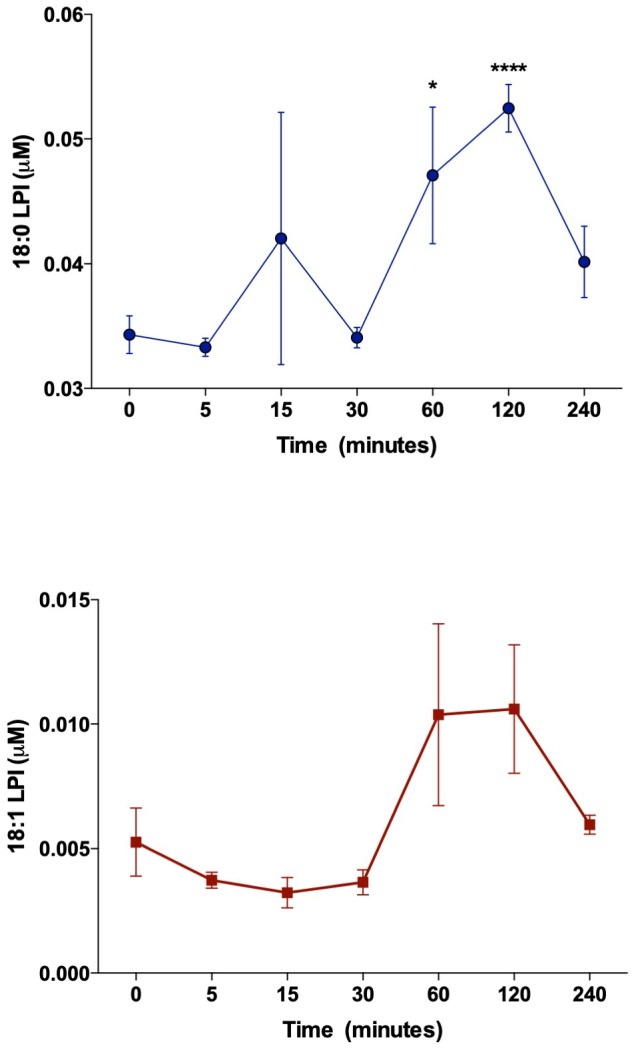
For dose testing 8–10 week old male WT C57BL/6 mice were fasted for 5 hr prior to an IP injection of the MBOAT7 substrate 18:0 LPI or 18:1 LPI. Over the course of 4 hr, plasma was isolated and 18:0 and 18:1 LPI levels were measured by quantitative LC-MS/MS (n = 4; *p≤0.05, ****p≤0.001; One-way ANOVA Tukey’s post-hoc test). Data are presented as mean ± S.E.M.
Figure 8—figure supplement 2. 18:0 LPI stimulates pro-inflammatory and pro-fibrotic gene expression in a Mboat7-dependent manner.

Male C57BL/6 mice were treated with either a non-targeting control ASO or Mboat7 ASO while being fed a high fat diet for 11 weeks. Thereafter, mice were injected IP with saline (vehicle) or 12.5 μg of the Mboat7 substrate lipid 18:0 LPI (2 injections at 7 am and seven pm), and liver was collected 12 hr later. Hepatic RNA levels of Mboat7 (A), Cd11c (B), Desmin (C), Col1A1 (D), Col1A2 (E), and Acta2 (F) were measured by qPCR (n = 5; *p≤0.05, **p≤0.01, ***p≤0.001, ****p≤0.0001; Two-way ANOVA with Tukey’s post-hoc test). Data are presented as mean ± S.E.M.
Figure 8—figure supplement 3. LPI lipids alter hepatic gene expression.

C57BL/6 mice were fed chow and injected IP with saline (vehicle) or 12.5 μg of the Mboat7 substrate lipid 18:0 LPI (2 injections at 7 am and seven pm), and liver was collected 12 hr later. Liver RNA was used for RNA-sequencing. Injection groups clustered by principal component analysis (A). Row-normalized expression for the top 50 DEGs are shown by heat map (B) while the volcano plot (C) summarizes log2 fold changes vs significance in response to LPI injection (n = 5; genes with FDR < 0.05 and fold change >2 were considered significantly differentially expressed). (D) Summary of significantly differentially regulated pathways in mice treated with a saline vehicle or 18:0 LPI. (E) qPCR validation of selected gene expression changes discovered in the RNA-sequencing analysis in both Chow and HFD-fed mice receiving Control or MBOAT7 ASOs for 20 weeks (n = 8–10; *p≤0.05, ***p≤0.001, ****p≤0.0001; Two-way ANOVA with Tukey’s post-hoc test). All data are presented as mean ± S.E.M., unless otherwise noted.