
Figure 3. Replisome mutants exhibited higher silencing-loss rates in the CRASH assay.
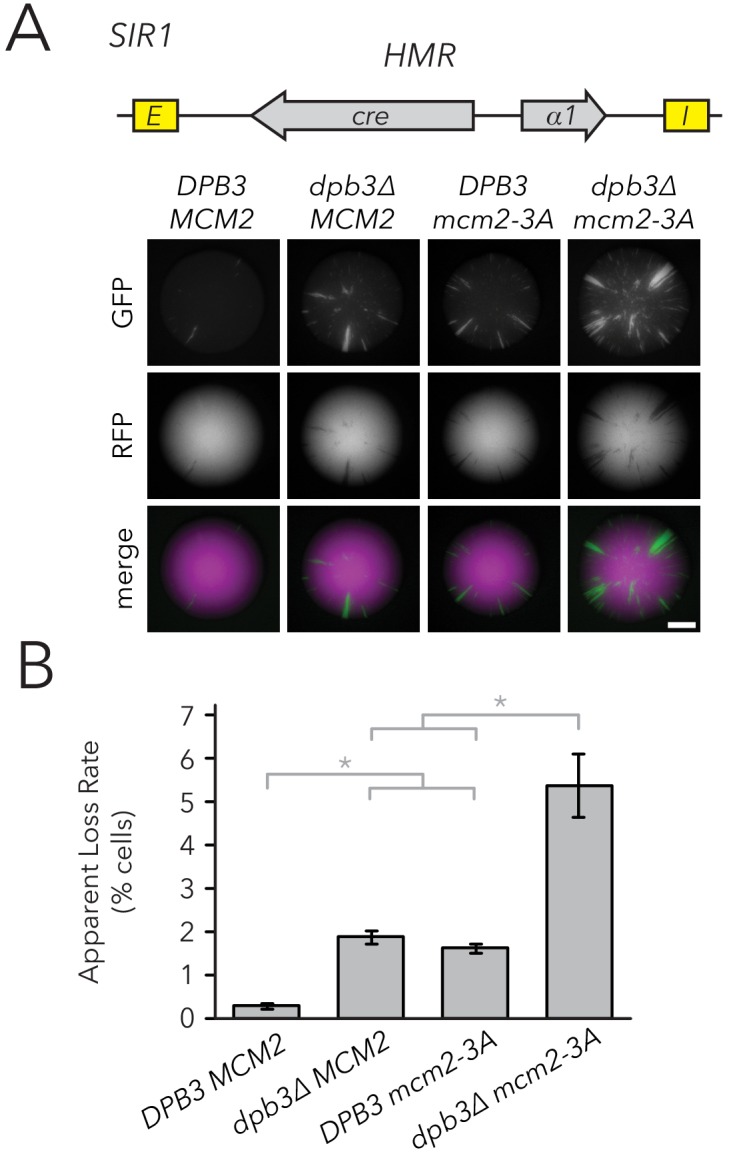
(A) Representative CRASH colonies for DPB3 MCM2 (JRY11471), dpb3∆ MCM2 (JRY11562), DPB3 mcm2-3A (JRY11591), and dpb3∆ mcm2-3A (JRY11592). Scale bar, 1 mm. (B) Quantification of apparent silencing-loss rates of strains in (A), as described in Materials and methods. Data are means ± SD (n = 6 independent cultures). ANOVA and Tukey tests were used to test statistical significance. DPB3 MCM2 was significantly different than dpb3∆ MCM2 and DPB3 mcm2-3A (p<0.05 each), and dpb3∆ mcm2-3A was significantly different than dpb3∆ MCM2 and DPB3 mcm2-3A (p<0.05 each).