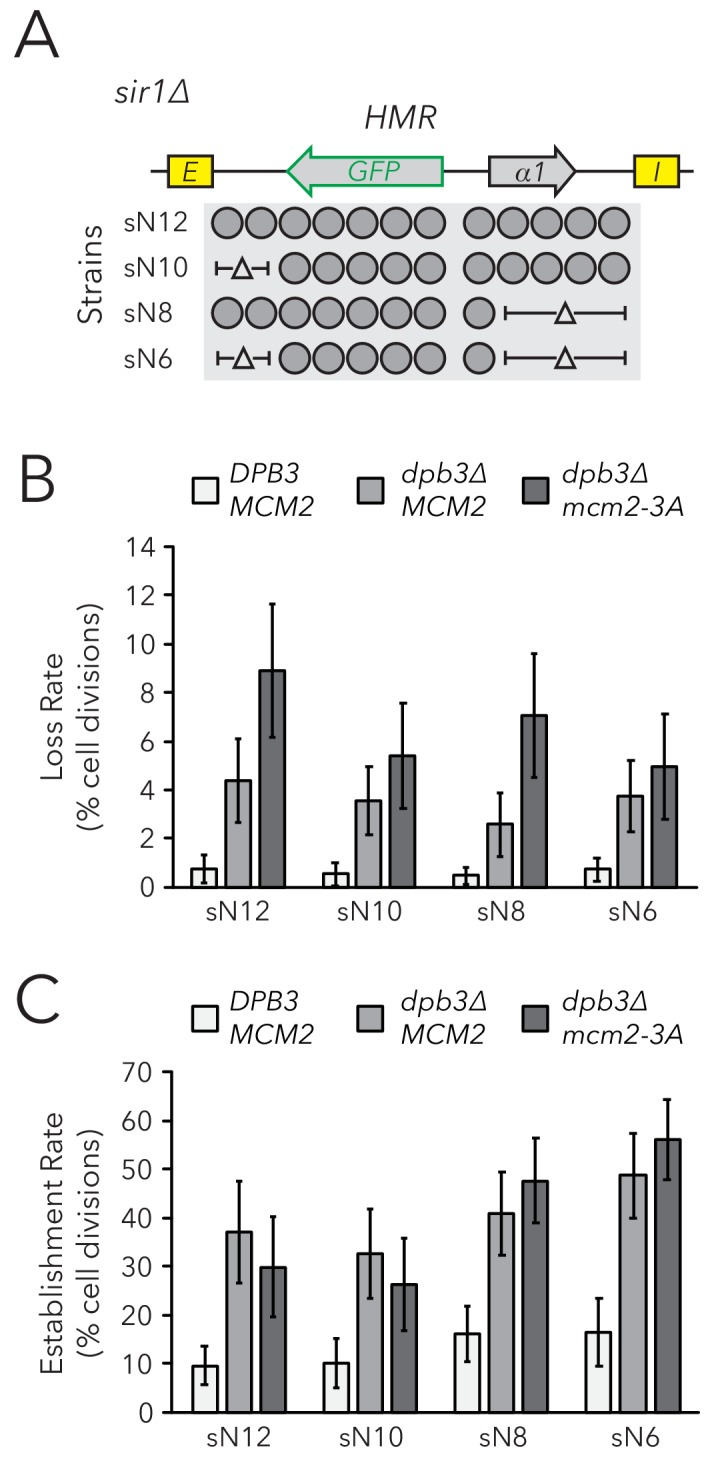
Figure 5. Chromatin domain size did not strongly affect epigenetic switching rates in replisome mutant backgrounds.
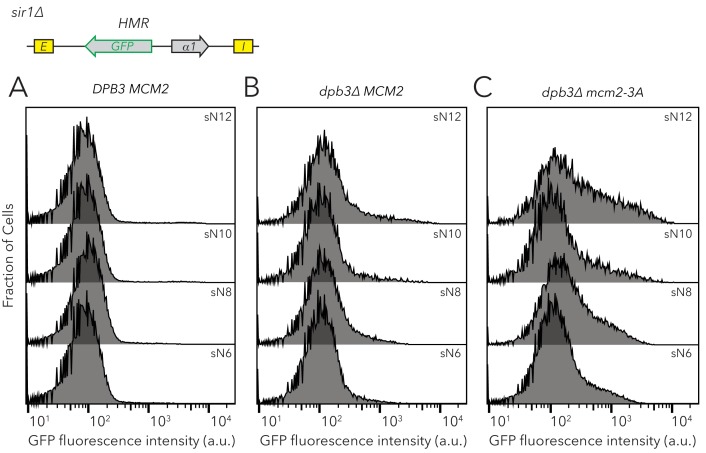
(A) Diagram of nucleosomes in HMRα::GFP, as seen in Figure 2B. As before, combinations of nucleosomal DNA were deleted to change the size of HMRα::GFP; the largest allele contained twelve nucleosomes (Strain sN12) (JRY11478) and the smallest allele contained six nucleosomes (Strain sN6) (JRY11547). Frequencies of silenced and expressed cells in these strains were measured by flow cytometry and shown in Figure 5—figure supplement 1. (B) Loss-of-silencing rates in the FLAME assay. Replisome mutant strains DPB3 MCM2 (JRY11478) (white), dpb3∆ MCM2 (JRY11550) (gray), and dpb3∆ mcm2-3A (JRY11590) (dark gray) with different numbers of nucleosomes at HMRα::GFP were analyzed by time-lapse microscopy (n > 300 cell divisions for each genotype). (C) Establishment-of-silencing rates for the same strains as in (B), calculated by time-lapse microscopy (n > 80 cell divisions per genotype). Loss and establishment rates of DPB3 MCM2 (JRY11478) are identical to those in Figure 2D,E and shown here for convenience. Error bars represent 95% confidence intervals.


