. 2019 Nov 12;8:e50778. doi: 10.7554/eLife.50778

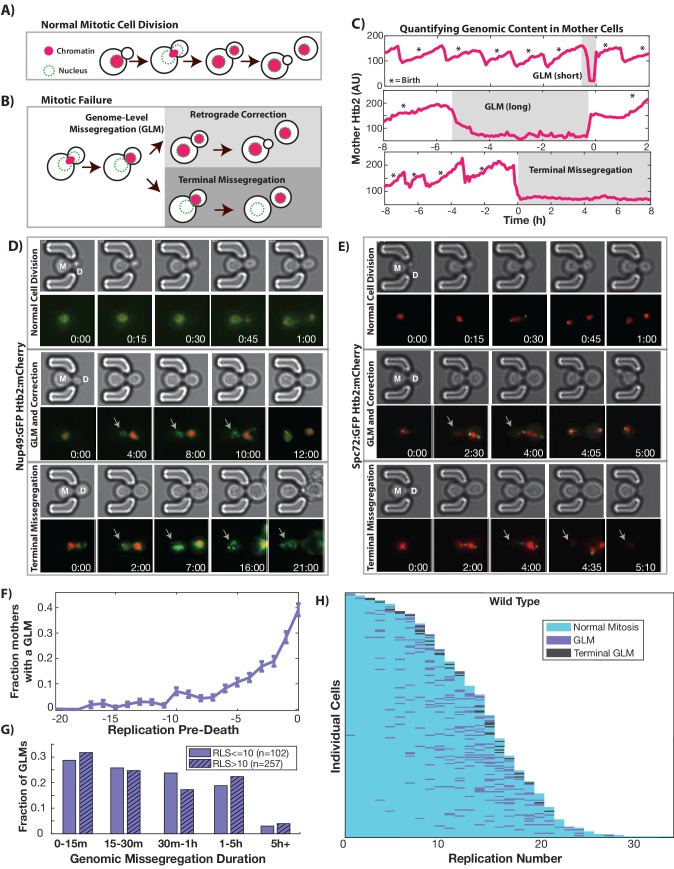
Figure 1. During replicative aging cells frequently undergo dramatic genomic missegregation events.

(A) Schematic showing the process of a normal cell division where chromatin (red) doubles during S-phase and is divided between mother and daughter during mitosis. (B) Aging cells frequently experience Genome Level Missegregation (GLM) events where most genomic material enters the daughter while the nuclear envelope appears in both cells. Usually this missegregation is corrected through retrograde transport of genomic material back into the mother cell (top), allowing mother cells to go on to divide and produce more daughters. If not corrected and cytokinesis occurs (bottom), this becomes a terminal event wherein mother cells replicatively senesce. (C) Representative single cell traces of mother Htb2 levels showing missegregation (shaded) and active retrograde correction events. GLMs can be resolved quickly (top) or resolution can take hours (middle). A GLM becomes terminal (bottom) if it is not corrected. (*) indicates the formation of new buds, and both cells where the GLM is corrected produce additional daughters. AU indicates arbitrary units. (D) Time-lapse dynamics showing a normal cell division (top, mother cell replicative age 6), a GLM that is corrected (middle, mother cell replicative age 14) and a terminal missegregation (bottom, mother cell replicative age 12) in cells co-expressing Htb2:mCherry and Nup49:GFP. During both GLMs the nuclear envelope is clearly visible in both mother (M) and daughter (D) cells. See Video 1. (E) Time-lapse dynamics showing a normal cell division (top, mother cell replicative age 12), a GLM that is corrected (middle, mother cell replicative age 13) and a terminal missegregation (bottom, mother cell replicative age 16) in cells expressing Htb2:mCherry and Spc72:GFP. Both spindle poles can be seen to enter the daughter (D) during these events, and during the correction event a spindle pole returns to the mother (M). In the terminal missegregation, the spindle pole fails to reenter the mother cell. See Video 2. Times are indicated in hours:mins from the start of the displayed time-lapse, not the start of the experiment. Arrows indicate mother cells which have lost DNA via a GLM. (F) Missegregation probabilities increase dramatically near the end of replicative lifespan. n = 410 mother cells examined, and error bars are SEM. (G) Many GLMs are corrected within an hour, but some events can last several hours, and the duration of events is not influenced by the replicative age of the mother cell (p>0.05, Student’s t-test). Terminal missegregation events were excluded from the analysis. (H) Survival curve showing the dynamics of individual wild-type mother cells. Each row is a separate mother cell, and the color indicates whether a cell experienced a normal cell cycle, GLM or terminal missegregation (n = 200 randomly selected cells).

Figure 1.

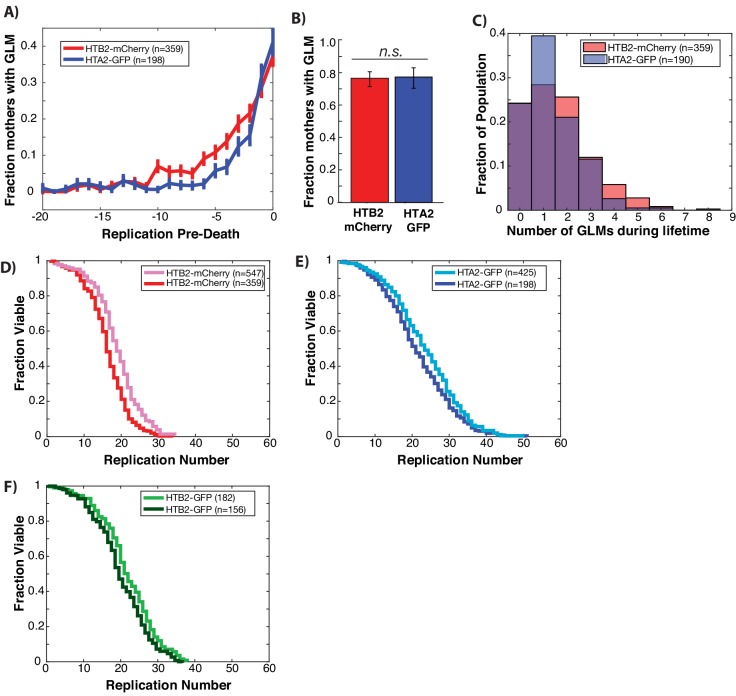
Figure 1—figure supplement 1. GLMs increase at end of life regardless of histone tagged and fluorophore used.

Figure 1—figure supplement 1.

(A) Both Htb2:mCherry and Hta2:GFP strains experience a dramatic increase in the probability of GLM events in the 5–6 divisions preceding death. Error bars are standard error. (B) There is no difference between Htb2:mCherry and Hta2:GFP with respect to the fraction of cells that experience GLM events. Error bars are 95% confidence intervals from bootstrapping over individual cells and bars that do not overlap indicate significance at the p=0.05 level. (C) The distribution of the number of GLM events that cells experience over their lifetime is similar between the strains but statistically different (p=0.02 two-tailed t-test), with Htb2:mCherry cells experiencing, on average, more events over their lifetime. (D) Replicative lifespan curves for Htb2:mCherry including censored cells (pink, median RLS=17) and excluding (red, median RLS=15). (E) Replicative lifespan curves for Hta2:GFP including censored cells (light blue, median RLS=23) and excluding (blue, median RLS=18). (F) Replicative lifespan curves for Htb2:GFP including censored cells (light green, median RLS=21) and excluding (green, median RLS=18).
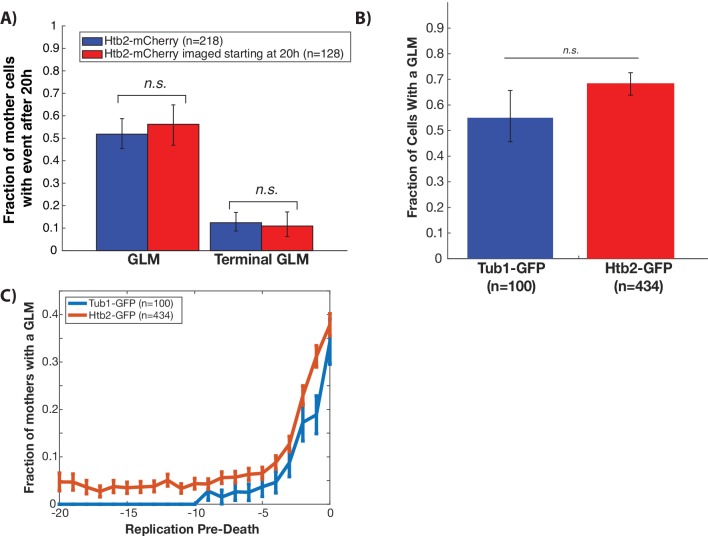
Figure 1—figure supplement 2. GLMs are not caused by experimental conditions.

Figure 1—figure supplement 2.

(A) To determine whether GLMs were caused by the cumulative exposure to fluorescence excitation energy, we compared GLM rates in cells imaged over their entire lifespans (blue) with those only imaged after they were already a median replicative age of 16 generations, or 20 hr (red). This is equivalent to ~75% of the median lifespan of this strain. To compare these cells to the control, we only quantified GLMs that occurred after 20 hr. Error bars are 95% confidence intervals generated by bootstrapping with replacement over all cells. No difference was found in either the fraction of cells with GLMs or the fraction of cells with terminal GLMs. This indicates that with our experimental conditions there is no cumulative effect of the fluorescence excitation light on the frequency of GLMs or the ability of cells to correct these GLMs. (B) GFP microtubules were tagged with GFP and used to determine whether cells were undergoing a GLM in a given cell cycle. Given the inability to directly observe chromatin in the Tub1:GFP strain, the criteria for a GLM was >80% of the labeled microtubules had to enter the daughter cell during mitosis. This criteria likely resulted in undercounting of GLM events. Error bars generated by bootstrapping with replacement so that non-overlapping error bars show significance at the p=0.05 level. (C) Both Htb2:mCherry and Tub1:GFP strains experience a dramatic increase in the probability of GLM events in the 5–6 divisions preceding death. This indicates the age related increase in events as cells approach death is not caused by labeling of the histones. Error bars are standard error.
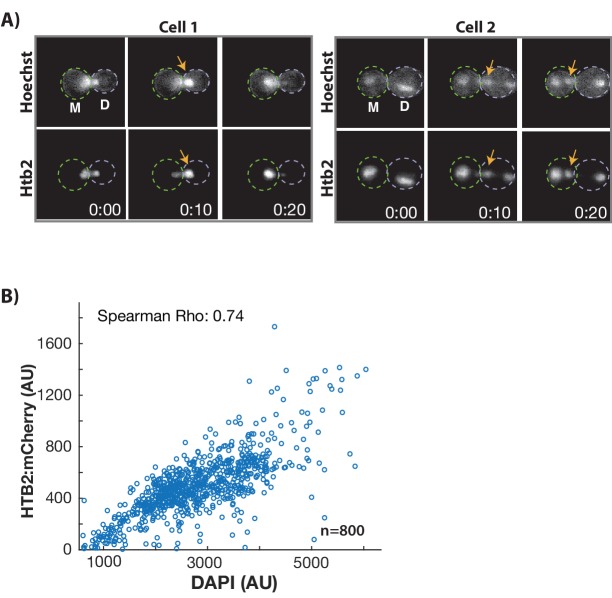
Figure 1—figure supplement 3. DNA moves in concert with histones during GLM events and are correlated with histone levels at the single cell level.

Figure 1—figure supplement 3.

(A) Genomic DNA and histones co-localize during GLM events. Two cells expressing Htb2:mCherry and stained with a live DNA dye Hoechst 3342. Histones and DNA can be seen to move in concert between both mother (M) and daughter (D) cells. See Video 5. (B) Wild-type cells were grown in the microfluidic device for 16 hr, and then fixed. Cells had a median replicative age of 13 divisions. The level of Htb2:mCherry is highly correlated (p<0.0001) with the level of DAPI staining at the single cell level in individual cells. This is true across the entire range of Htb2:mCherry fluorescence, as even cells that have the highest Htb2:mCherry levels have correspondingly high DAPI staining. N = 800 individual mother cells.
Figure 1—figure supplement 4. Resolution of GLMs is important to achieve a full lifespan, and GLMs are anti-correlated with remaining lifespan.

Figure 1—figure supplement 4.

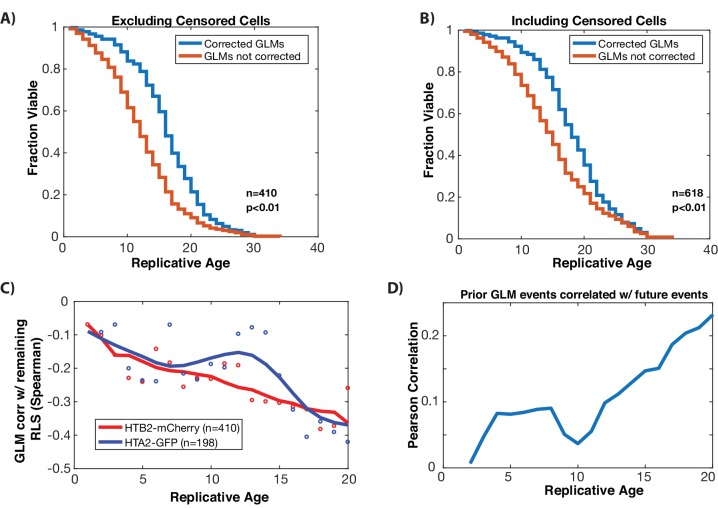
(A) Correcting GLM events significantly increase replicative life span. Comparison of experimentally observed replicative lifespan (where cells can correct GLMs), to expected lifespan if all GLMs were terminal (not corrected) for wild type cells. To generate the GLM not corrected lifespan, the first GLM event for each mother cell was assumed to be terminal, and the lifespan was truncated accordingly. This plot uses only cells that die in the device. Correcting GLM events results in an increase of median lifespan by 33% (p<0.001). (B) Same as in panel A, but including cells that are censored. The increase in median lifespan is 29% (p<0.001). (C) At the single cell level, GLM events are correlated with impending mortality (anti-correlated with remaining lifespan, as shown), and become more predictive (more strongly anti-correlated, as shown) with increasing replicative age. The strength of the anti-correlation with age is similar regardless of the fluorophore used or histone protein tagged. Dots show correlation between an individual histone and the remaining lifespan at that replicative age. To show trends, these have been smoothed with a moving average (solid line). (D) GLM events are not stochastic, but past history of events is predictive of future GLM events. At each replicative age, cells that have had prior GLM events are more likely to have them. Shown is the Pearson correlation at the single cell level, between the number of prior GLM events prior to that age, and the occurrence of an event at that age. The positive correlation indicates that prior events are predictive that cells will experience a GLM at a given age. This suggests that GLM events could be linked to an underlying cellular state linked to the occurrence of DNA damage, or reduced repair ability.
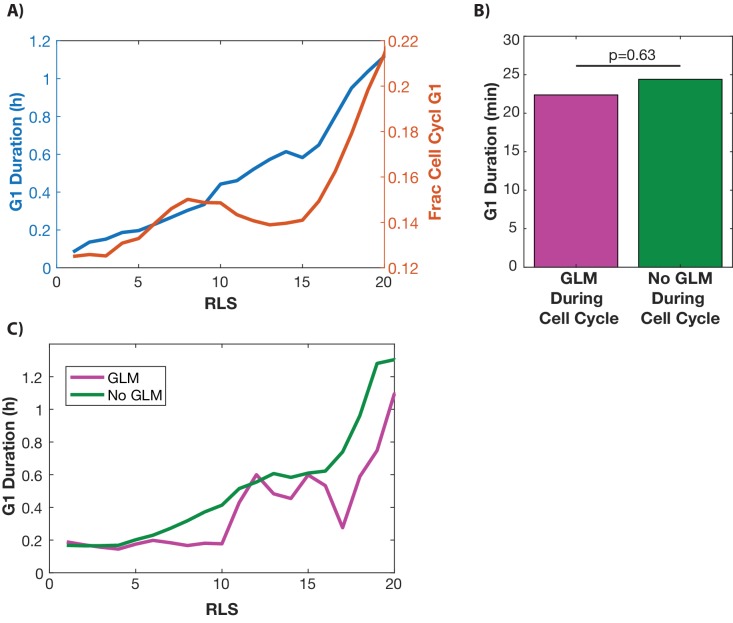
Figure 1—figure supplement 5. G1 duration is not linked to GLM events at the single cell level.

Figure 1—figure supplement 5.

(A) Cells with WHI5:GFP and HTB2:mCherry were imaged for their whole life. Single cells. (B) From birth until the replicative age 15, fob1∆ cells experience on average fewer GLMs than wild-type. Over their whole replicative lifespan, however, fob1∆ cells experience on average the same number of GLMs as wild-type cells. Error bars generated by bootstrapping with replacement so that non-overlapping error bars show significance at the p=0.05 level, and ** indicates significance at the p<0.01 level.