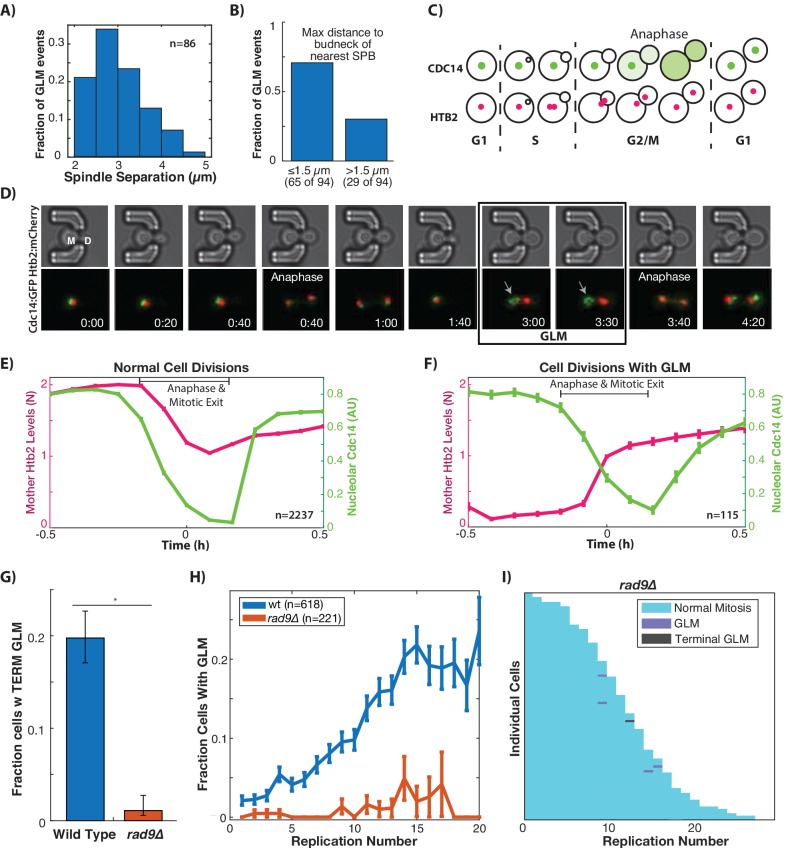
Figure 3. GLMs occur during arrest at the metaphase DNA checkpoint.
(A) Histogram of spindle pole separation for cells arrested during GLMs. Separation was measured at three timepoints for each cell, and the average for each cell was used for the histogram (n = 86). (B) Distance from nearest spindle pole body (SPB) to the bud neck during the GLM. Both SPB are in the daughter during these events. (C) Schematic showing Cdc14 dynamics during the cell cycle. Cdc14 is localized to the nucleolus, except during anaphase. (D) Timelapse images of a single cell containing Cdc14:GFP and Htb2:mCherry that goes through a normal division and then a division with a GLM. The arrow points to nucleolar localized Cdc14 during the GLM that is released to allow anaphase entry. See Video 7. Time is hours:minutes. (E) Plot shows average of single cell traces of cells undergoing normal cell divisions where both Cdc14 and Htb2 were imaged. Htb2 levels were normalized at the single cell level, so 1 is 1N, and cells cycles were aligned using Cdc14 dynamics. (F) Quantification of nucleolar Cdc14 in populations of cells confirms that anaphase entry is delayed in cells experiencing a GLM. Individual cells were aligned to time of correction event. Only GLMs that lasted >30 min were used, and error bars are standard error. (G) Mutants with compromised DNA damage checkpoint (rad9∆) have significantly reduced rates of terminal missegregations (H) Mutants with compromised DNA damage checkpoint (rad9∆) have no age-related increase in the GLM rate (p>0.05 determined by Cochran Q-test, plot shows mean and error bars are SEM). (I) Survival curve showing the significant reduction in GLM rates in individual rad9∆ mother cells. Each row is a separate mother cell, and the color indicates whether a cell experienced a normal cell cycle, GLM or terminal missegregation (n = 100 randomly selected cells).


