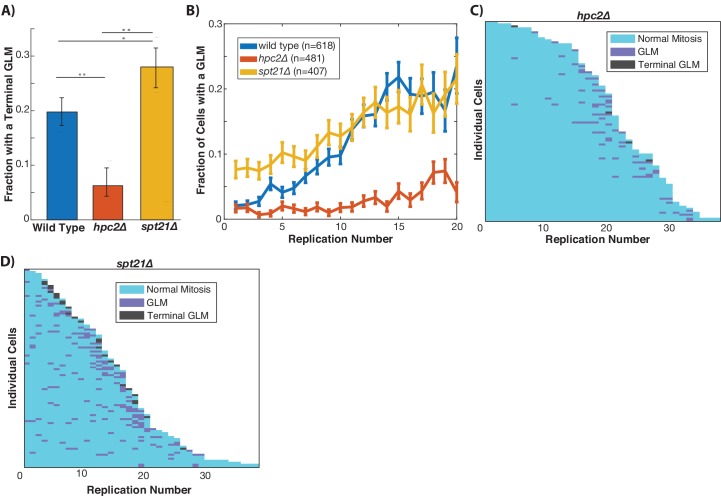
Figure 6. Histone transcription influences GLMs rates.
(A) Constitutive histone transcription (hpc2∆) significantly reduces GLM rates at the population level when compared with wild-type (p<0.001, **), while cells with reduced ability to transcribe histones (spt21∆) experience increased rates (p<0.05, *) compared with wild type cells. Error bars are confidence intervals generated by bootstrapping with replacement generated so that non-overlapping bars indicate confidence at the p=0.05 threshold. (B) At a population level, manipulating histone transcription affects GLM rates and cells with increased histone transcription (hpc2∆) do not show a significant age-related increase in GLMs (curve shows mean and error bars are SEM, p>0.05 for hpc2∆ determined by Cochran Q-test). Error bars are standard error. (C) Survival curve showing the significant reduction in GLM rates in individual hpc2∆ mother cells. Each row is a separate mother cell, and the color indicates whether a cell experienced a normal cell cycle, GLM or terminal missegregation (n = 100 randomly selected cells). (D) Survival curve showing the significant increase in GLM rates in individual hpc2∆ mother cells (n = 100 randomly selected).

