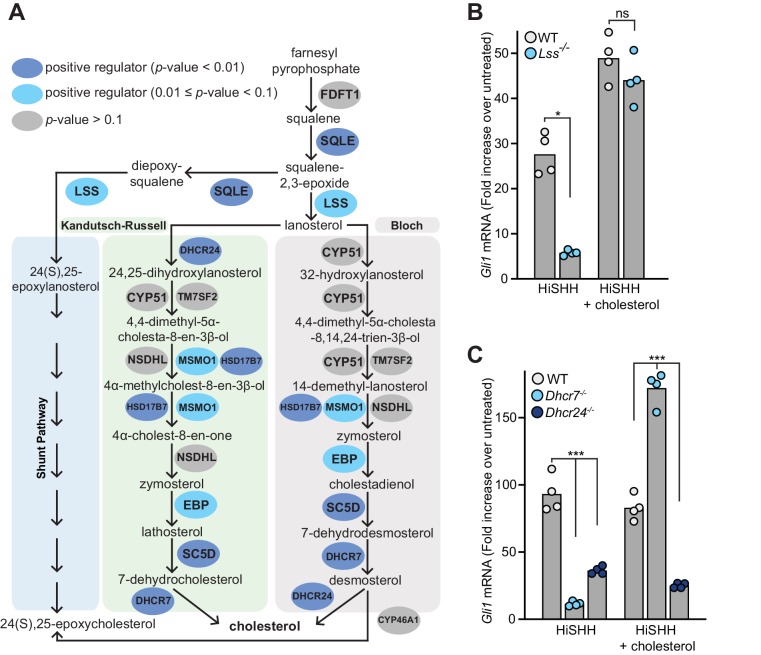
Figure 2. Enzymes that generate cholesterol positively regulate hedgehog signaling.
(A) The post-squalene portion of the cholesterol biosynthetic pathway, with enzymes colored according to their FDR corrected p-value in our CRISPR screens (see Supplementary files 2 and 3). Two branches of the pathway (the Kandutsch-Russell and the Bloch pathways) produce cholesterol, while a third shunt pathway produces 24(S), 25-epoxycholesterol. DHCR24 is the only enzyme that is required for cholesterol biosynthesis, but dispensable for 24(S), 25-epoxycholesterol synthesis. (B and C) HH signaling strength in Lss-/-, Dhcr7-/- and Dhcr24-/- NIH/3T3 cells was assessed by measuring Gli1 mRNA by quantitative reverse transcription PCR (qRT-PCR) after treatment with either HiSHH (25 nM) or HiSHH combined with 0.3 mM cholesterol:MβCD complexes. Bars denote the mean value derived from the four individual measurements shown. Statistical significance was determined by the Mann-Whitney test (B, p-value for HiSHH treatment = 0.0286, p-value for HiSHH + cholesterol treatment = 0.4857) or the Kruskal-Wallis test (C, p-value for HiSHH treatment = 0.0002, p-value for HiSHH + cholesterol treatment = 0.0002).


