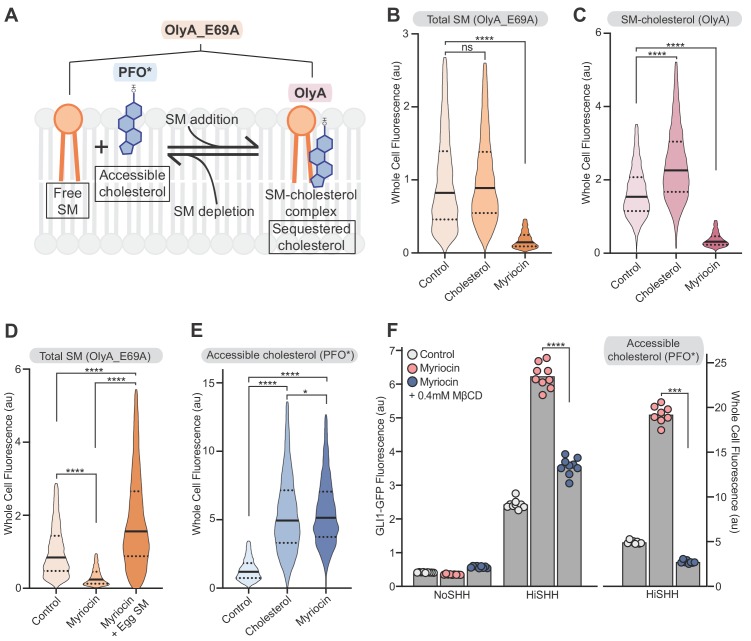
Figure 5. Reducing accessible cholesterol in myriocin-treated cells impairs hedgehog signaling.
(A) Cholesterol and SM form SM-cholesterol complexes in which cholesterol is sequestered and prevented from interacting with proteins like SMO. The ratio of SM to cholesterol determines the level of accessible cholesterol (free from SM). Protein probes detecting the various pools of cholesterol and SM are shown: PFO* binds to accessible cholesterol, OlyA to SM-cholesterol complexes and OlyA_E69A to both free SM and SM-cholesterol complexes. (B–E) Flow cytometry of intact cells stained with fluorescently-labeled OlyA_E69A (B and D), OlyA (C) or PFO* (E) after the indicated treatments (n > 4000 cells for each condition). (F) HiSHH-induced (50 nM) GLI1-GFP reporter fluorescence in NIH/3T3-CG cells treated with myriocin alone or myriocin followed by 0.4 mM MβCD to reduce accessible cholesterol levels. The graph on the right shows whole cell fluorescence of cells stained with PFO* to measure accessible cholesterol in the outer leaflet of the plasma membrane. Each data point denotes the mean fluorescence of GLI1-GFP or PFO* staining calculated from ~200 cells from two separate experiments and the bars denote the mean value. Statistical significance was determined by the Mann-Whitney test (B–F); p-values are: (B) p-value=0.9486 for control vs cholesterol treated cells and p-value<0.0001 for control vs myriocin treated cells, (C) p-value<0.0001 (both comparisons), (D) p-value<0.0001 (all comparisons), (E) p-value<0.0001 (control vs cholesterol and control vs myriocin) and p-value=0.0195 for cholesterol vs myriocin, (F) p-value<0.0001 for GLI-GFP fluorescence comparison and p-value=0.0002 for PFO* comparison.

