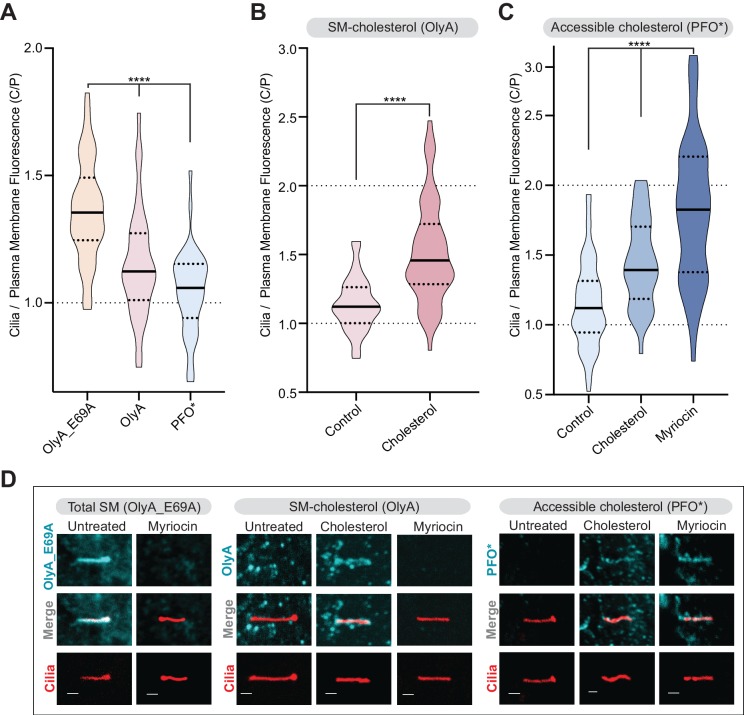
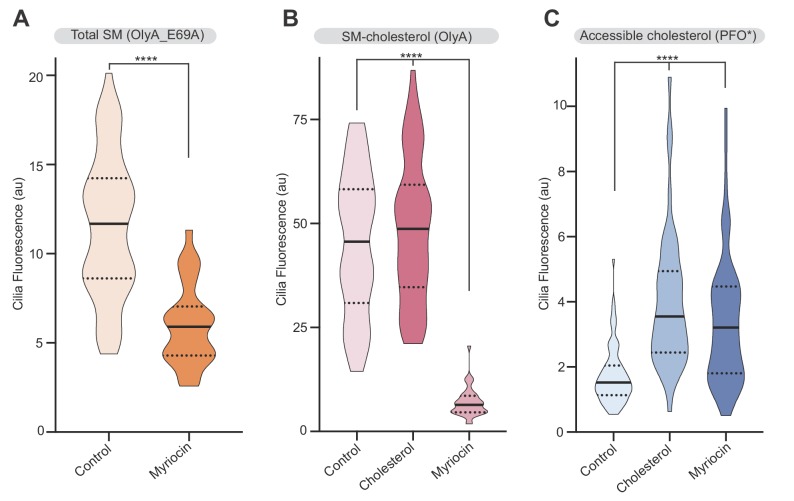
Figure 7. Primary cilia have high sphingomyelin and low accessible cholesterol.
(A–C) Ratio of mean ciliary staining intensity to mean plasma membrane staining intensity (the C/P ratio, see text) for OlyA_E69A, OlyA, or PFO* (see Figure 5A) in NIH/3T3 cells left untreated (A) or treated with either myriocin (80 μM) or cholesterol-MβCD complexes (B and C) (A-C, n > 30 cilia per condition). (D) Representative images of individual primary cilia from cells stained with each of the lipid probes (colored blue) after the indicated treatments. Cells stably expressed ARL13B-GFP (colored red) to allow the identification of cilia. Scale bar: one micron. Statistical significance was determined by the Kruskal-Wallis test (A and C) or the Mann-Whitney test (B); all p-values are <0.0001.


