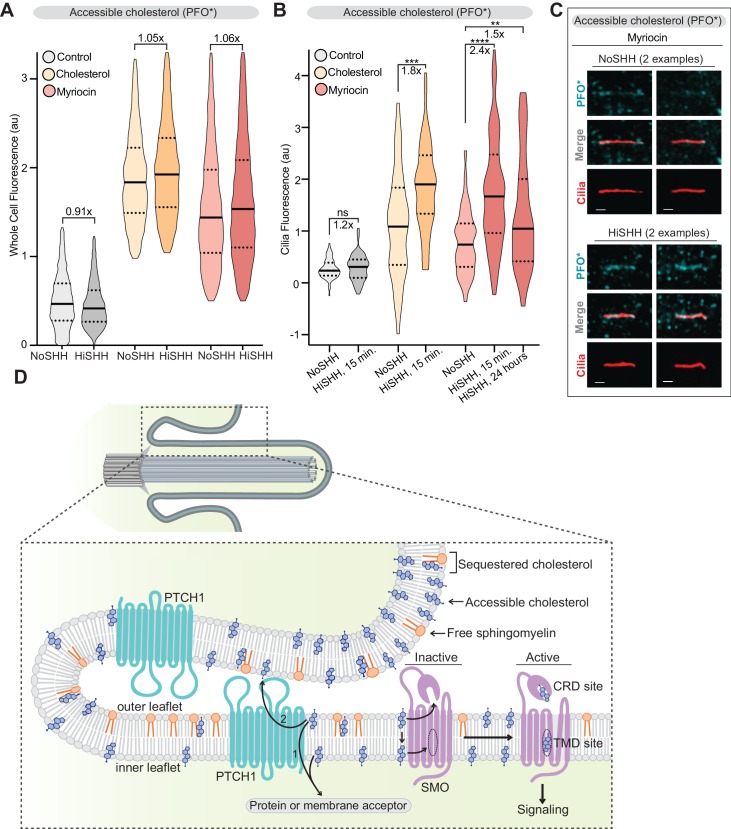
Figure 8. PTCH1 decreases the pool of accessible cholesterol at primary cilia.
(A) Flow cytometry was used to measure plasma membrane PFO* staining in intact cells after HiSHH treatment (n > 4000 cells per violin). Fold changes of median values (SHH treated over untreated) are indicated (A and B). (B) PFO* staining at primary cilia after the addition of HiSHH in cells treated with myriocin (80 μM), cholesterol:MβCD complexes or left untreated (n > 65 cilia per condition). (C) Representative images of primary cilia from cells treated with myriocin with or without the addition of HiSHH. Scale bar: one micron. (D) Model depicting how PTCH1 could inhibit SMO at primary cilia by decreasing accessible cholesterol in the ciliary membrane (see Discussion for details). PTCH1 could transport cholesterol from the ciliary membrane to an intracellular acceptor (1) or to an extracellular acceptor (2). PTCH1 inactivation leads to an increase in accessible cholesterol in both leaflets of the ciliary membrane, leading to SMO activation through the CRD and TMD sterol-binding sites. Statistical significance was determined by the Mann-Whitney test (B); p-values are: NoSHH vs HiSHH p-value=0.5984, cholesterol treated NoSHH vs HiSHH p-value=0.0008, myriocin treated NoSHH vs HiSHH 15 min p-value<0.0001 and 24 hour p-value=0.0277.


