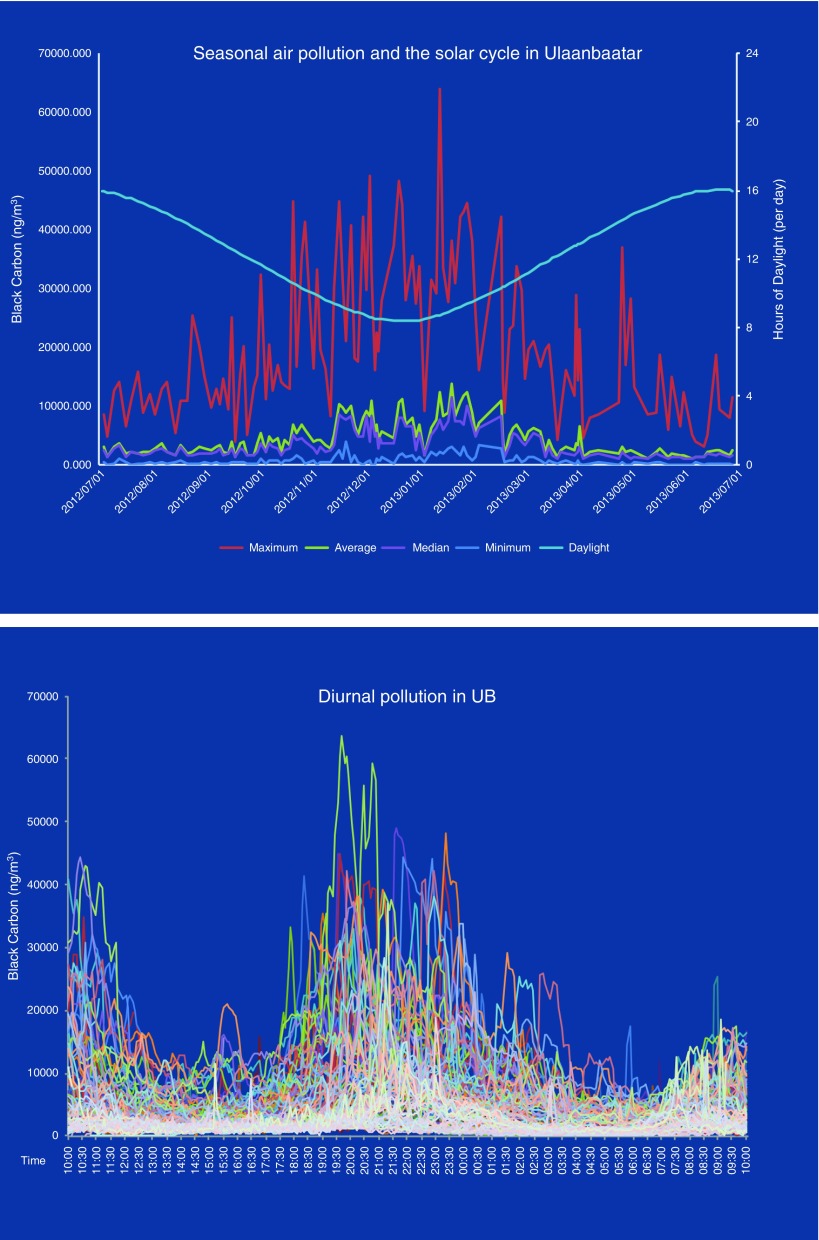
Figure 3.
Top: Annual seasonal air pollution. The relative black carbon particulate matter concentrations in central Ulaanbaatar (UB) are depicted as maximum (red), minimum (dark blue), mean (green), and median (mauve). Hours of daylight is depicted in light blue. Black carbon units are expressed as nanograms per cubic meter. Bottom: Intradiurnal black carbon pollution levels. Each curve represents one individual day. Days were recorded over the course of one year and are superimposed to display patterns of diurnal variation over the course of one year. The bimodal distribution of black carbon pollution with separate peaks in the morning and evening is well illustrated. Data in the upper and lower panels are used by generous and gracious permission of Christa Hassenkopf and were recorded in the climate laboratory of Prof. Sereeter Lodoysamba at the National University of Mongolia. The figure was prepared by Nicole Warburton using these data.

