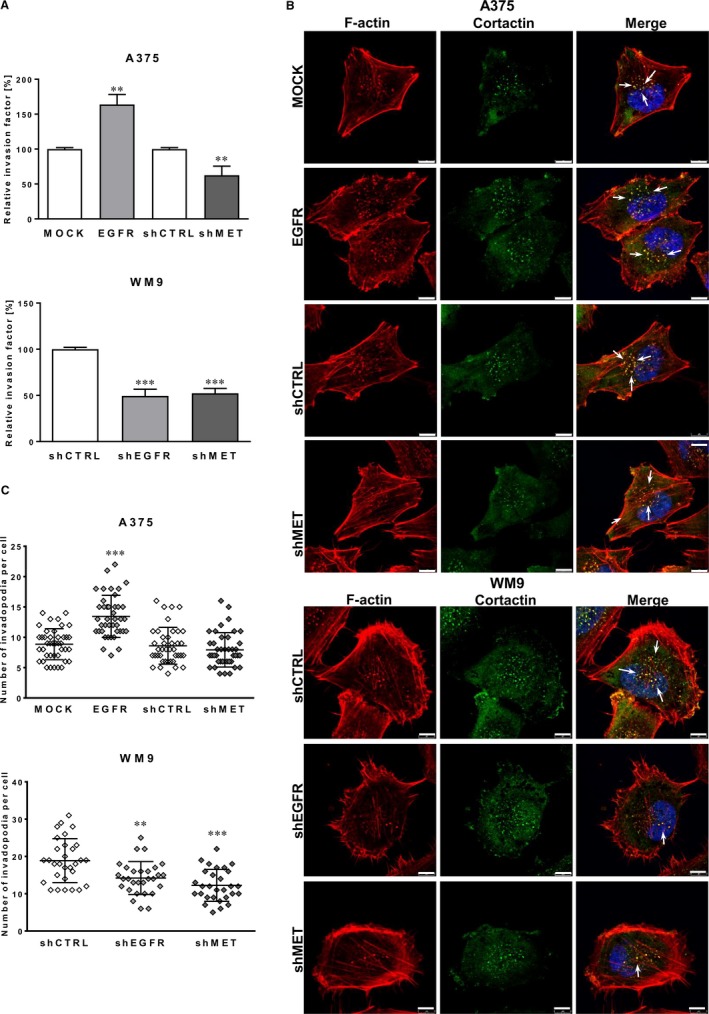
Figure 3.

Impact of EGFR and MET on invasion abilities and invadopodia formation in examined melanoma cell lines. A, The invasion assay performed on transwell filters coated with Matrigel for 24 h. Relative invasion factor was calculated versus control cells, where number of invading control cells is set as 100%. Results are expressed as the mean ± SD of three independent experiments. B, Representative pictures of A375 (MOCK, EGFR, shCTRL and shMET) and WM9 (shCTRL, shEGFR and shMET) cells seeded on Matrigel‐coated coverslips stained for F‐actin (red), cortactin (green) and cell nuclei (blue). Arrows indicate invadopodia. Scale bar—8 μm. C, Quantification of the average number of invadopodia in examined cells. Invadopodia formed by at least 40 cells from three independent experiments were counted, and results are presented as the mean ± SD. (**) P ≤ .01, (***) P ≤ .001
