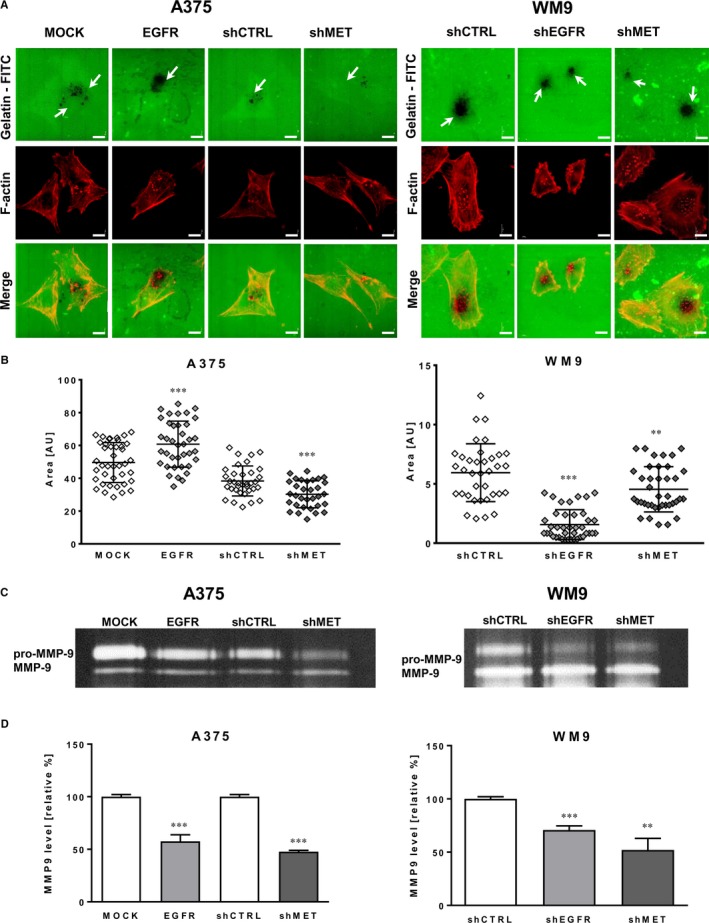
Figure 4.

Proteolytic activity of melanoma cells with altered EGFR and MET expression. A, Representative pictures of proteolytic activity of A375 (MOCK, EGFR, shCTRL and shMET) and WM9 (shCTRL, shEGFR and shMET) cells (F‐actin visible in red) detected using FITC‐conjugated gelatin (green). Gelatin degradation indicated with white arrows is visualized as the dark areas on the fluorescently labelled gelatin background. Scale bar—10 µm. B, Quantification of digestion area calculated using ImageJ software from at least 40 cells from three independent experiments. Results are presented as the mean ± SD. C, MMP‐9 activity in concentrated conditioned media tested by gelatin zymography with (D) densitometric analysis. Results are expressed as the mean ± SD of three independent experiments. (**) P ≤ .01, (***) P ≤ .001
