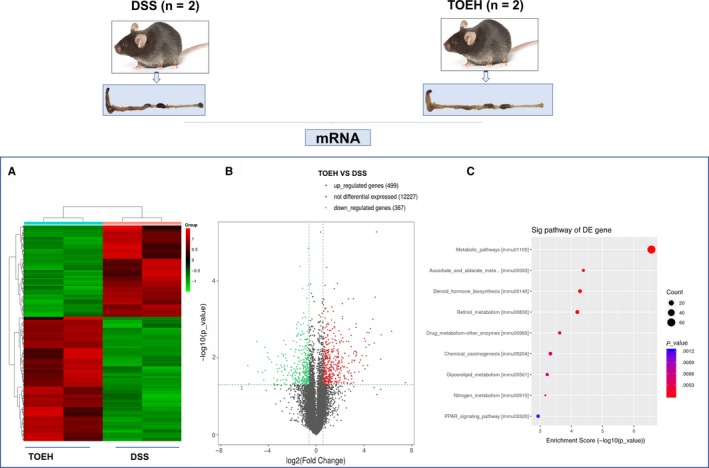
Figure 3.

The differentially expressed genes were identified between DSS and TOEH groups by transcriptome sequencing. A, Hierarchical clustering analysis was performed to establish the gene expression profiling between these two groups. B, Volcano plotting of the differentially expressed genes between DSS and TOEH groups. Red colours indicated the up‐regulated genes and blue colours indicated the down‐regulated genes. C, The genes that were most significantly differentially expressed were analysed by KEGG enrichment analysis
