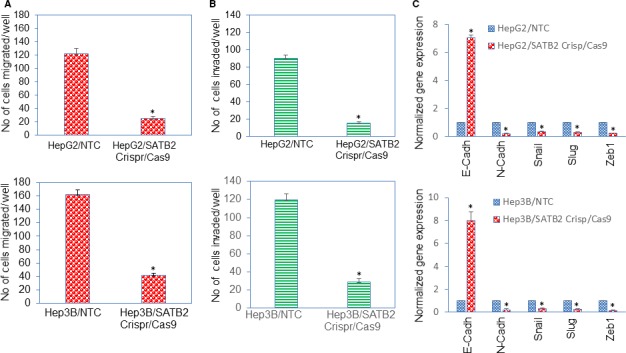
Figure 3.

Inhibition of SATB2 expression suppresses cell migration, and invasion, and modulates the expression of EMT‐related gene expression in HepG2 and Hep3B cells. A, HepG2/NTC, Hep3B/NTC, HepG2/SATB2 Crispr/Cas9 and Hep3B/SATB2 Crispr/Cas9 cells were grown for 48 h. Cell migration assay was performed as described in Section 2. Data represent mean (n = 4) ± SD. * = significantly different from NTC control group, P < .05. B, HepG2/NTC, Hep3B/NTC, HepG2/SATB2 Crispr/Cas9 and Hep3B/SATB2 Crispr/Cas9 cells were grown for 48 h. Cell invasion assay was performed as described in Section 2. Data represent mean (n = 4) ± SD. * = significantly different from NTC control group, P < .05. C, HepG2/NTC, Hep3B/NTC, HepG2/SATB2 Crispr/Cas9 and Hep3B/SATB2 Crispr/Cas9 cells were grown. RNA was isolated and the expressions of E‐Cadherin, N‐Cadherin, Snail, Slug and Zeb1 were measured by qRT‐PCR analysis. Data represent mean (n = 4) ± SD. * = significantly different from NTC control group (P < .05). Gene expression of NTC control group was normalized to 1
