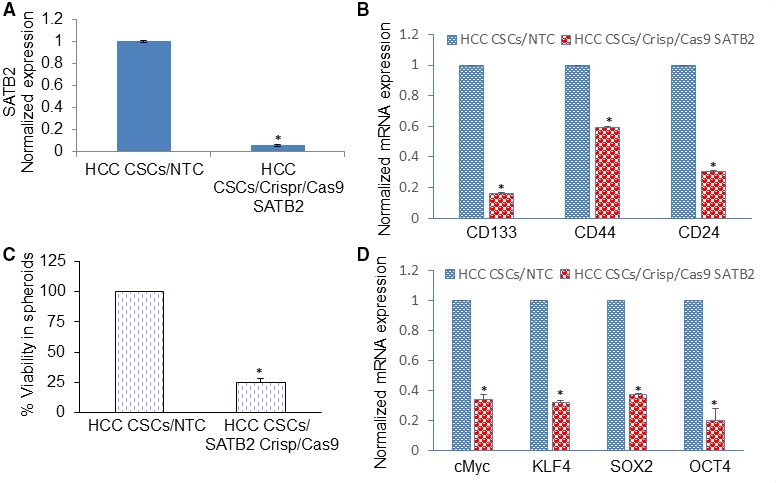
Figure 4.

Inhibition of SATB2 expression suppresses cell viability in spheroids and stem cell markers and pluripotency maintaining factors in HepG2 and Hep3B cells. A, CSCs derived from primary HCC tissues were transduced with lentiviral particles expressing either SATB2 Crispr/Cas9 or non‐targeting control from a pooled population by targeting four different sites (GeneCopoeia, Rockville, MD). RNA was extracted from cells, and qRT‐PCR analysis was performed to measure the expression of SATB2. Data represent mean ± SD (n = 4). * = significantly different from NTC group (P < .05). B, CSCs/NTC and CSCs/SATB2 Crispr/Cas9 cells were grown for 6 d, and cell viability in spheroids was measured by XTT assay. Data represent mean ± SD (n = 4). * = significantly different from NTC group (P < .05). C and D, RNA was isolated from CSCs/NTC and CSCs/SATB2 Crispr/Cas9 cells. The qRT‐PCR analysis was performed to measure the expression of stem cell markers (CD133, CD44 and CD24) and pluripotency maintaining factors (c‐Myc, KLF4, SOX2 and OCT4). GAPDH was used as an internal control. Data represent mean ± SD (n = 4). * = significantly different from CSCs/NTC group, P < .05. Note that the expression of genes in the control group was normalized to 1
