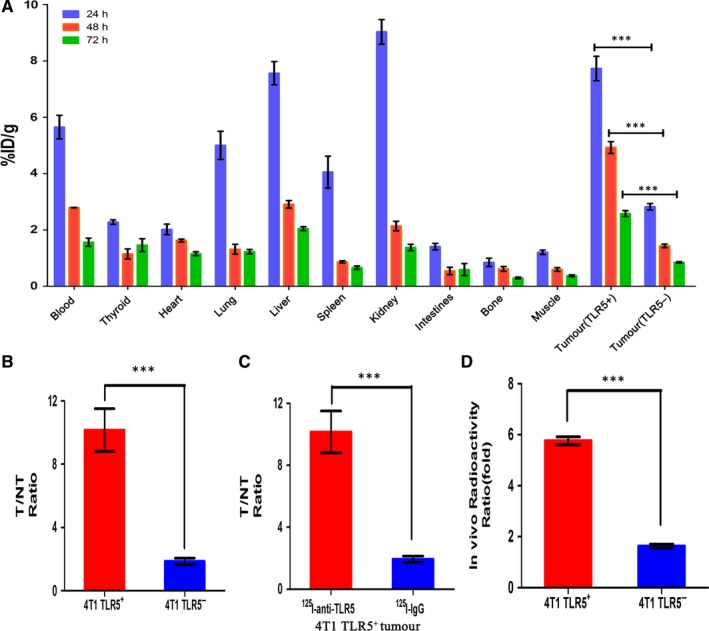
Figure 4.

Ex vivo biodistribution studies. Biodistribution of two tracers at 24, 48 and 72 h after tracer injection in different organ or tissues. Tissue radioactivity is expressed as %ID/g, the per cent injected dose per gram (A). The radioactivity ratio of target (tumour) to NT (non‐target, opposite muscle) for TLR5+/− 4T1 cells bearing mice injected with 125I‐anti‐TLR5 at 48 h (B). Comparison of TLR5+ 4T1 cells bearing mice injected with 125I‐anti‐TLR5 and 125I‐ IgG at 48 h (C). Comparison of in vivo radioactivity ratio (DLU/mm2, digit light units per mm2 from tumour and opposite same quantity area) of TLR5+/− 4T1 tumours in whole‐body phosphor‐autoradiography at 48 h (D). n = 5, *** P < .01. The data are presented from three independent experiments. The data were analysed by Student's t test. * P < .05, *** P < .01
