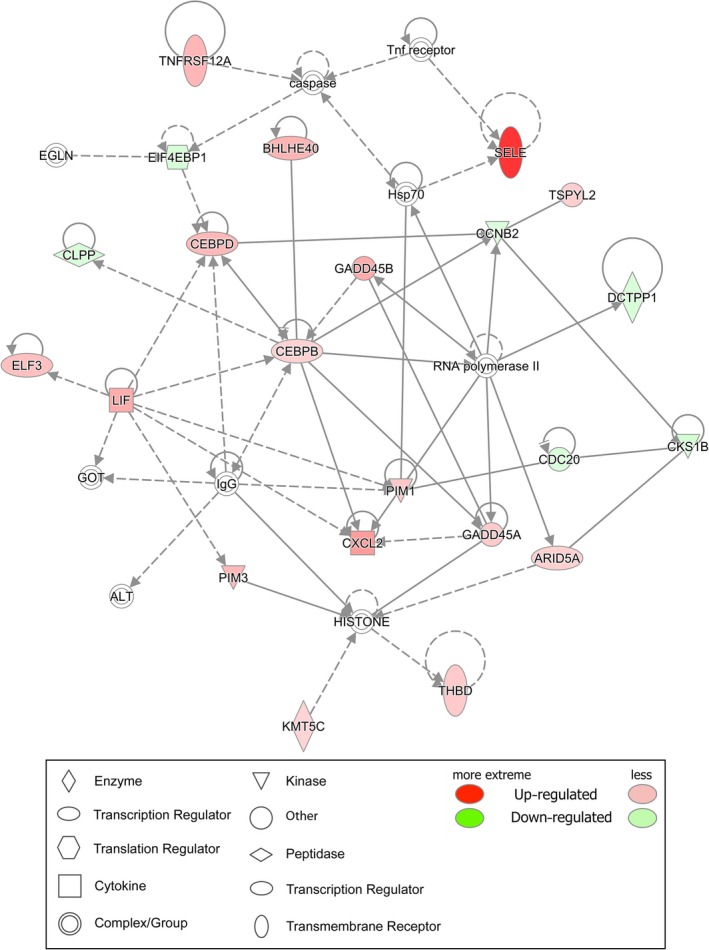
Figure 4.

The molecular interaction networks analysis of genes with differential expression. Cellular Development, Cellular Growth and Proliferation, Embryonic Development. Red colour represents that the gene expression level is increased in endometrium from women with adenomyosis, and the darker the colour, the greater in gene expression level. On the opposite, green represents the gene expression level was decreased in endometrium from women with adenomyosis
