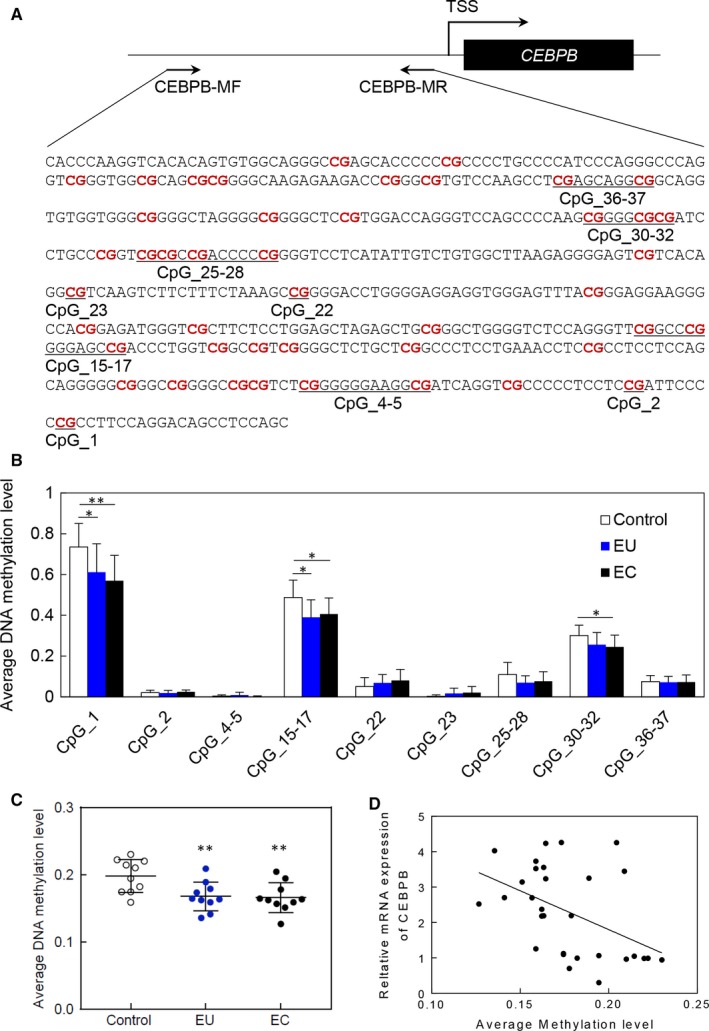
Figure 6.

DNA methylation analysis of CEBPB in different endometrial tissues. A, Schematic representation of the TSS and the proximal promoter region of CEBPB gene. Positions and orientation of the MassARRAY primers are indicated by black arrows. The analysed CpG sites by MassARRAY are listed in order. B, The average DNA methylation level of each CpG unit in the amplicon among different endometrial tissues. C, The whole DNA methylation level of CEBPB among different endometrial tissues. D, Correlation analysis of CEBPB between DNA methylation and gene expression level. EC, ectopic endometrium; EU, eutopic endometrium; **P < .01, *P < .05
