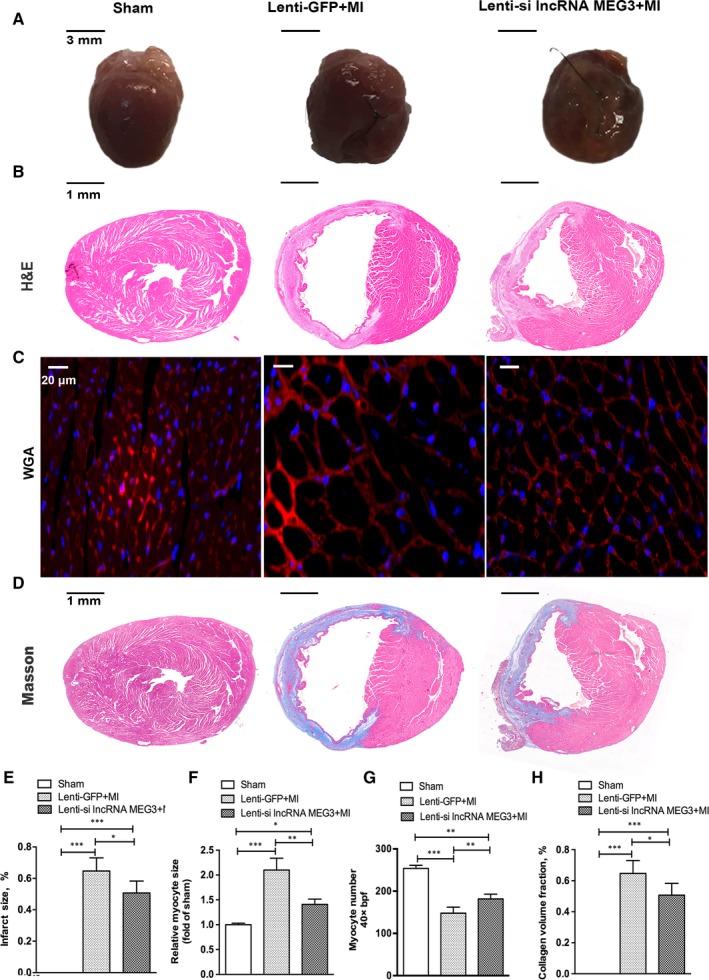
Figure 2.

lncRNA MEG3 knockdown reduced infarcted size and cardiac fibrosis. Hearts were collected for analysis at 28 days post‐MI. A, Representative images and bar graph of heart tissues from sham, lenti‐GFP and lenti‐si lncRNA MEG3 mice were shown (n = 3 each group). The infarct area (white) from each section was measured (relative to LV area). Scale bar = 3 mm. B, Representative images of haematoxylin and eosin (H&E) were shown (n = 6 each group). Scale bar = 1 mm. C, Representative images of WGA staining were shown in the border zone of MI (n = 4 each group). Scale bar = 20 μm. D, Representative images of Masson staining were shown (n = 6 each group). Scale bar = 1 mm. E, Representative images of calculation of infarct size from each section of H&E staining (relative to LV area). F‐G, Representative images of calculation of myocyte size and myocyte number in the border size of MI based on WGA staining. H, Representative images of calculation of collagen volume fraction from each section of Masson staining (relative to LV area).Values expressed as mean ± SD; *P < .05, **P < .01, **P < .001
