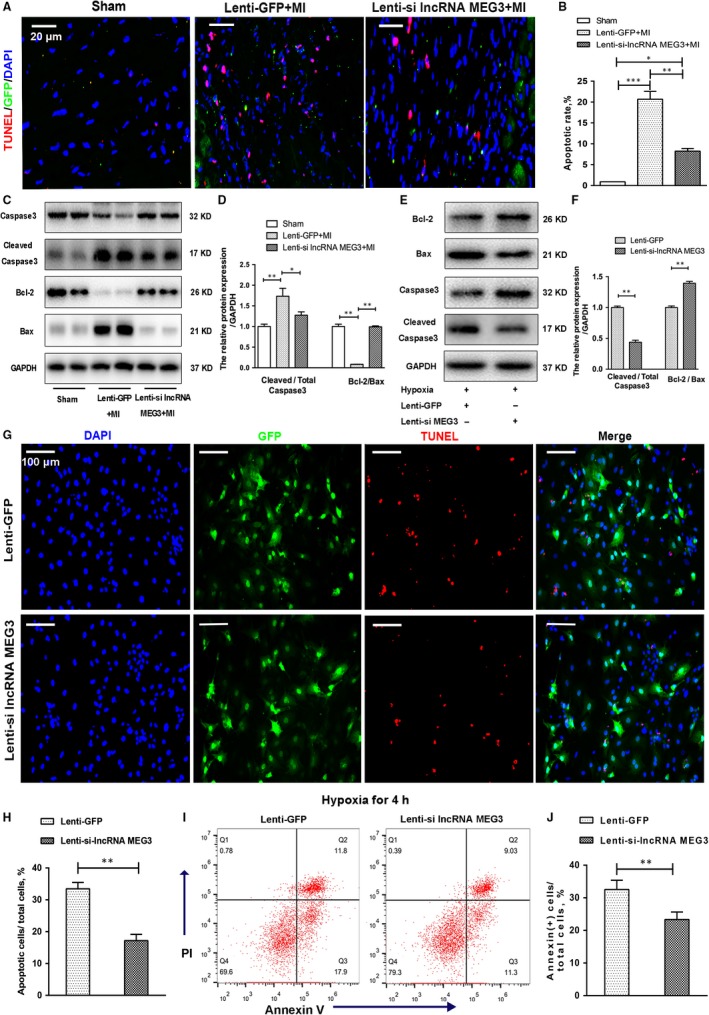
Figure 3.

Knockdown of lncRNA MEG3 inhibited apoptosis in vivo and in vitro. A, Representative images of TUNEL staining showed cardiac apoptosis in infarct border zone from mice heart tissues. Scale bar = 20 μm. B, The apoptotic index was calculated by dividing the cell number of TUNEL‐positive nuclei by the total number of cells (n = 4 each group). C, Caspase 3, cleaved caspase 3, Bax and Bcl‐2 from mice heart tissues were detected by immunoblotting. The intensity of each band was quantified by densitometry, and the data were normalized to the GAPDH signal (D) (n = 7 each group). E‐F, Cardiomyocyte apoptosis was detected by flow cytometry 4 h after hypoxia. And the early apoptotic cells with Annexin (+) cells were calculated (n = 3 each group). G‐H, These protein expression levels of caspase 3, cleaved caspase 3, Bax and Bcl‐2 in hypoxia NMVMs were detected by immunoblotting and were quantified (n = 3 each group). I‐J, Representative images and quantification of cardiomyocyte apoptosis under hypoxia were detected by TUNEL staining (n = 3 each group). Scale bar = 100 μm. All data were reported as mean ± SD; *P < .05, ** P < .01, ***P < .001
