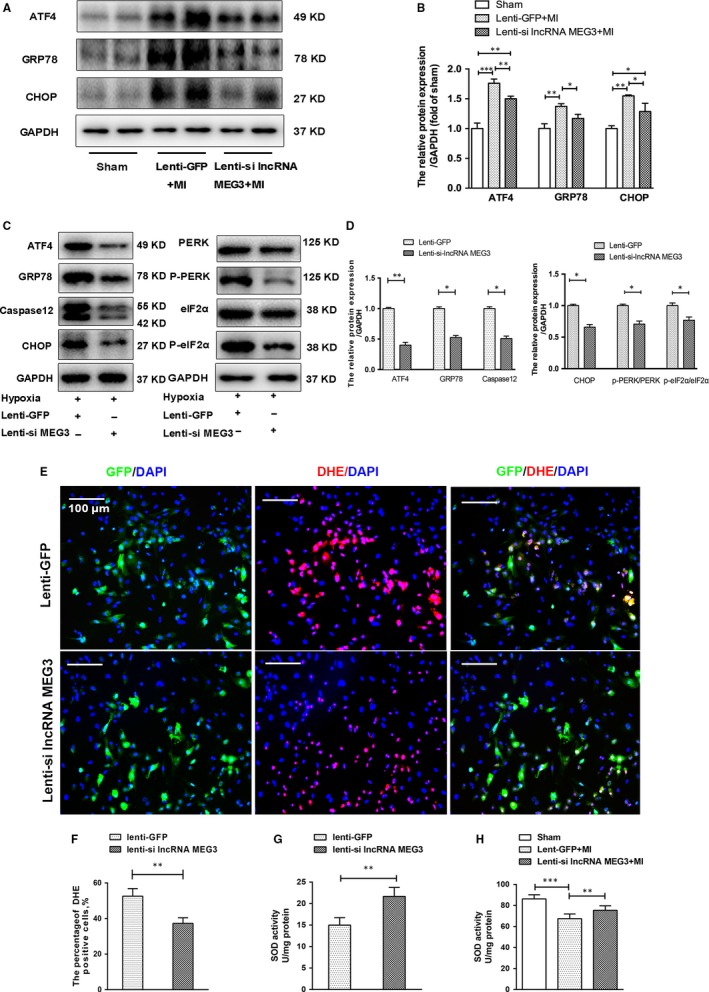
Figure 4.

Knockdown of lncRNA MEG3 decreased ERS‐related protein expression levels and ROS production. A, Western blotting showed protein expression levels of GRP78, ATF4 and CHOP from mice hearts 4 wk post‐MI. B, The protein levels were quantified by densitometric analysis and normalized to the levels of GAPDH (n = 7 per group). C, Western blotting showed the expressions of ERS‐related proteins (GRP78, CHOP, caspase‐12, ATF4), and PERK‐eIF2α pathway (PERK, p‐PERK, eIF2α, p‐eIF2α) in hypoxia NMVMs. D, These protein expression levels were quantified and normalized to the levels of GAPDH (n = 3 each group). E‐F, Representative images and quantification of DHE staining were shown in hypoxia‐induced NMVMs in the absence or presence of lncRNA MEG3 knockdown. Scale bar = 100 μm. G‐H, SOD activities were detected in infarct cardiac tissues and hypoxic NMVMs after lentiviral transfection. Values expressed as mean ± SD; *P < .05, **P < .01
