
Figure 4.
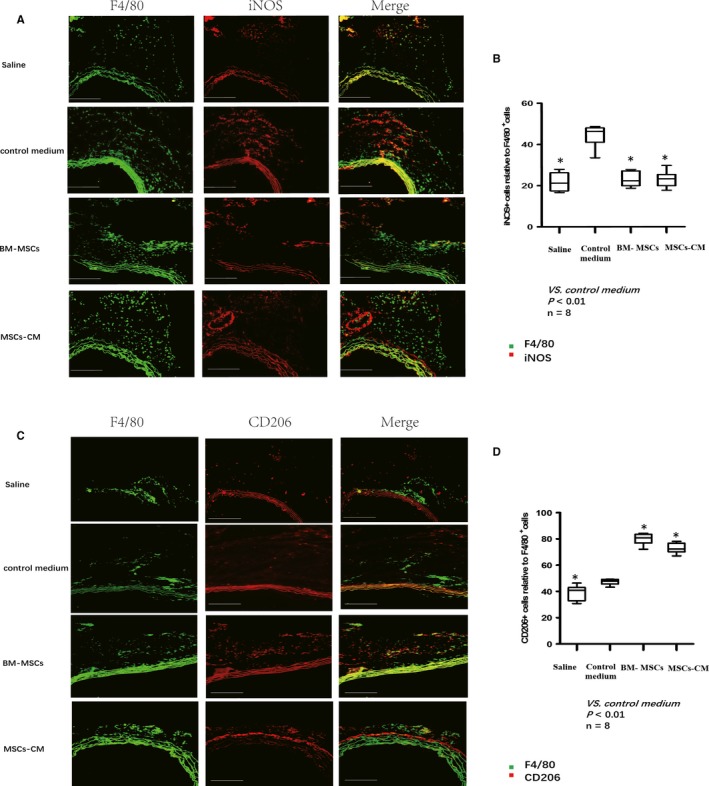
Macrophage polarization at the site of AA. A, M1 macrophage markers (iNOS) and total macrophage F4/80 were observed using immunofluorescence staining in the tissues collected at the site of AA on day 14. A decrease in iNOS+ cells was observed in both BM‐MSC and MSCs‐CM group comparing with the control medium group. B, The average percentage of iNOS+ cells were normalized with total macrophage F4/80+ cells and statistically analysed. Significantly reduction in iNOS+ cells was observed in the BM‐MSC group and MSCs‐CM group comparing with control medium group. C, M2 macrophage markers (CD206) and total macrophage F4/80 were observed using immunofluorescence staining in the tissues collected at the site of AA on day 14. An increase in CD206+ cells was observed in both BM‐MSC and MSCs‐CM group comparing with the control medium group. D, The average percentage of CD206+ cells were normalized with total macrophage F4/80+ cells and statistically analysed. Significantly increase in CD206+ cells was observed in both BM‐MSC and MSCs‐CM group comparing with the control medium group