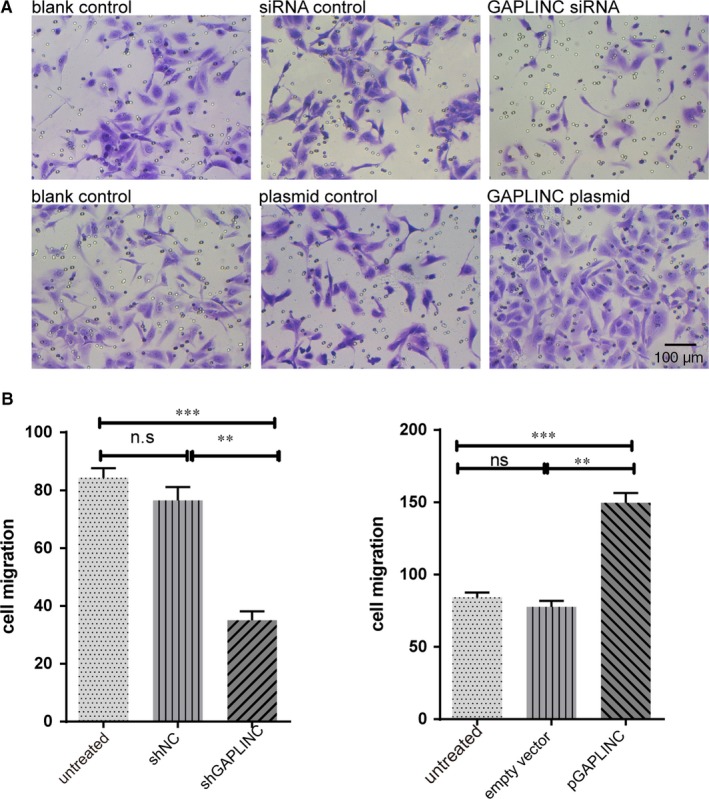
Figure 4.

The influences of GAPLINC on cell migration. The cell was treated with siRNA control, GAPLINC siRNA, empty plasmid and GAPLINC plasmids. A, The representative figures of cell migration in different condition as labelled on top of each figure B. The summary cell migration in both GAPLINC knockdown (Left) and overexpression condition (right). The results are presented as mean ± SD for three independent experiments. Each experiment performed in triplicate. *: P < .05, **: P < .01, ***: P < .001, ****: P < .0001
