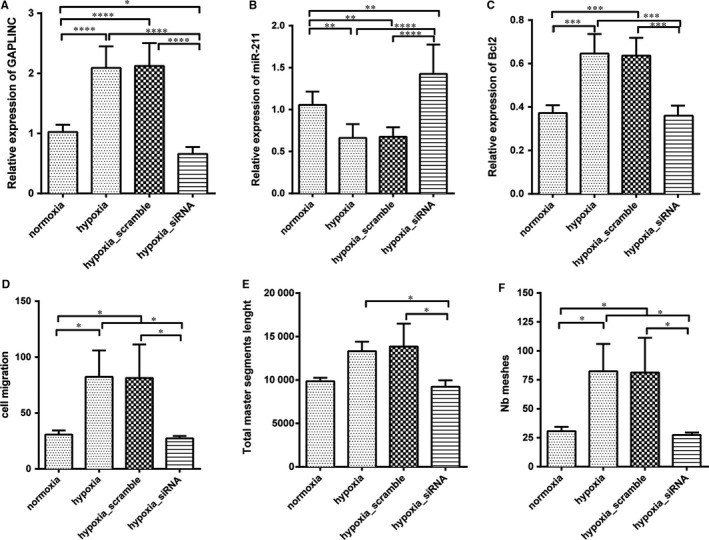
Figure 6.

Silencing of GAPLINC under hypoxia condition reverse angiogenesis effects. The cell was treated with normoxia, hypoxia, hypoxia with scramble siRNA and hypoxia with GAPLINC siRNA, respectively. A, Expression level of GAPLINC quantified by qPCR. B, Relative expression level of miR‐211 quantified by qPCR. C, Relative expression level of Bcl2 quantified by Western blotting. D, The cell migration assays were performed using transwell chamber. E, Total master segment length. F, Total number of meshes. The results are presented as mean ± SD for three independent experiments. Each experiment performed in triplicate. *: P < .05, **: P < .01, ***: P < .001, ****: P < .0001
