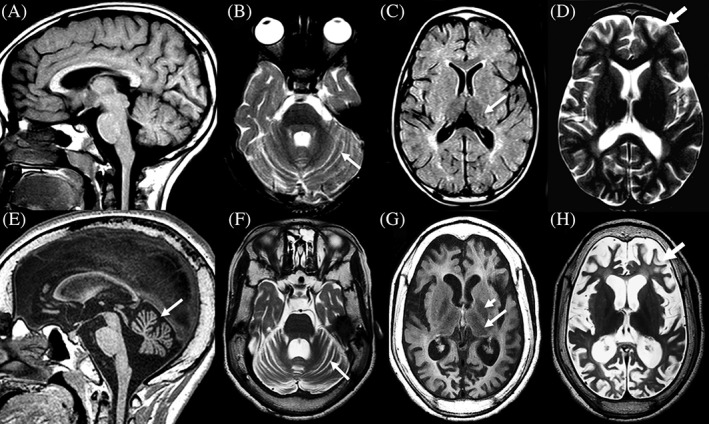
Figure 1.

Two brain MRIs and disease progression in a patient with CLN1 (PPT1) associated disease (patient 5, ID#76 in Table 1). Top row 4y2m (A‐D): Sagittal T1 weighted image (A) demonstrates a normal corpus callosum, brainstem and vermis. Axial T2 weighted image (B) reveals mild widening of the interfoliate sulci (arrow) of the cerebellar hemispheres. Axial FLAIR image (C) shows dark signal intensity of the thalami (arrow) and increased signal of the periatrial white matter. Mild widening of the supratentorial sulci is noted (arrow) on T2 weighted axial image (D). Bottom row 7y8m (E‐H): Marked thickening of the calvarium is shown on all images. There is volume loss of the corpus callosum and moderate atrophy of the vermis (arrow) on T1 weighted sagittal image (E). Progressive widening of the interfoliate sulci (arrow) of the cerebellar hemispheres is shown on axial T2 weighted image (F). There is persistent loss of thalamic signal and volume (arrow) on axial FLAIR image (G). On the same image, loss of globus pallidus signal is present (short arrow) and the white matter is diffusely abnormally increased in signal. Marked widening of the supratentorial sulci (arrow) and moderate ventricular enlargement is noted on axial T2 weighted image (H), reflecting both central and peripheral volume loss
