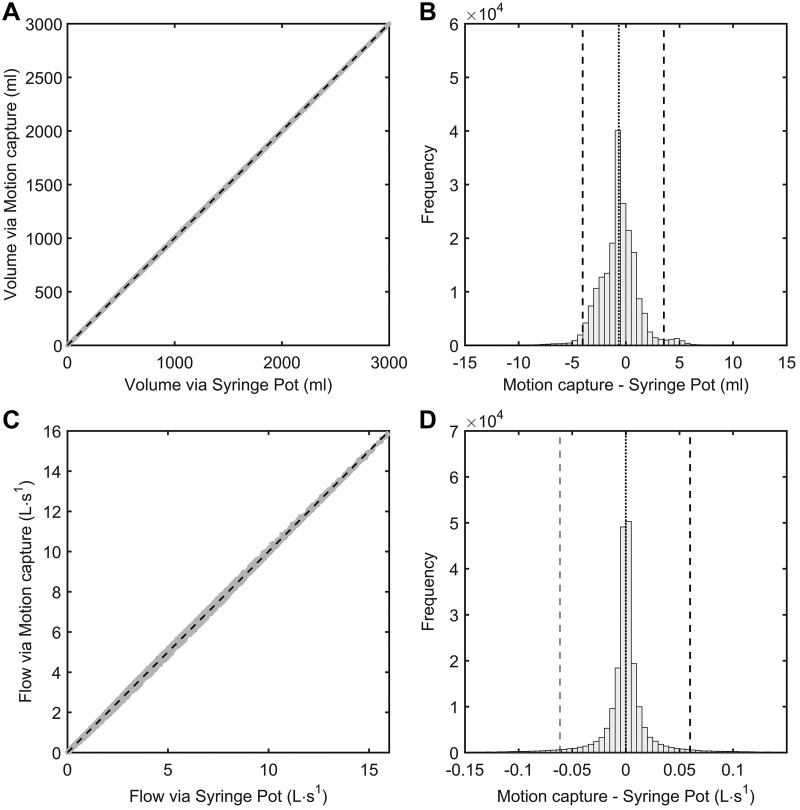
Fig. 3.
Measurement agreement of instantaneous syringe volume (A and B) and flow rate (C and D) obtained via the syringe potentiometer device and motion capture system. The gray points in A and C represent observed values of syringe volumes and flows measured via the syringe potentiometer device and motion capture system. The dashed lines in A and C denote lines of identity (i.e., perfect agreement) for each relationship. The vertical dashed lines in B and D illustrate the 95% confidence percentiles for the distribution of errors incurred by measuring syringe volume and flow via the syringe potentiometer device (whereby values obtained via motion capture are taken as the reference).

