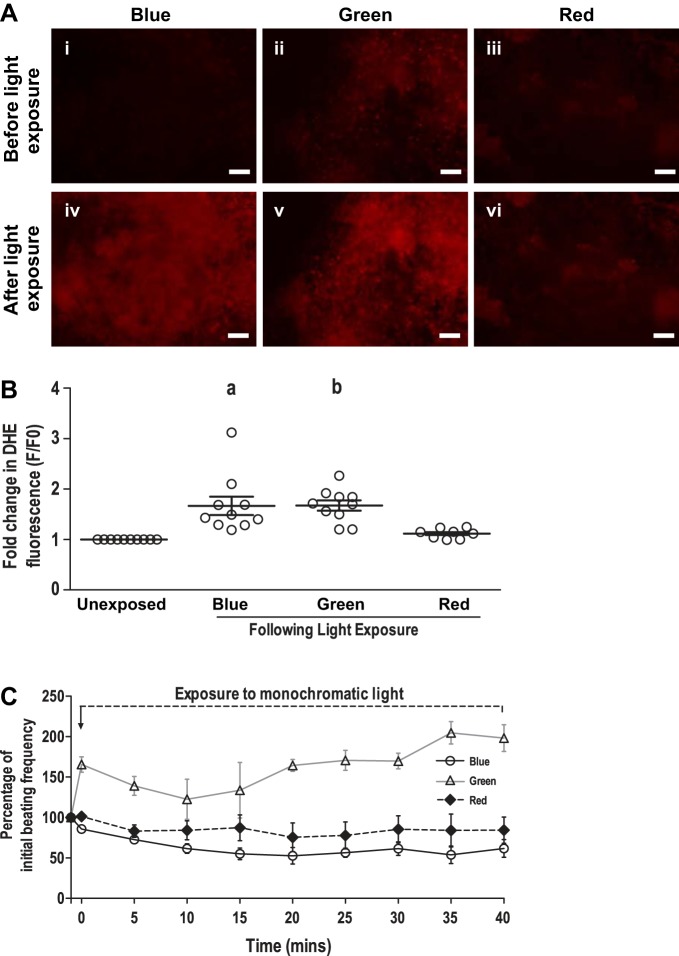
Fig. 6.
Assessment of intracellular reactive oxygen species (ROS) levels in beating cardiomyocyte clusters derived from GS-2 embryonic stem (ES) cells, following exposure to monochromatic light. A: representative images showing an intracellular ROS in beating cardiomyocyte clusters derived from GS-2 ES cells, following exposure to blue (i and iv), green (ii and v), and red (iii and vi) light evidenced by dihydroethidium (DHE) fluorescence. B: fold change in DHE fluorescence in cardiomyocyte beating clusters, following exposure to monochromatic light. C: time course of beating frequency in cardiomyocyte beating clusters derived from GS-2 ES cells, following exposure to blue, green, and red lights in medium supplemented with 10 mM N-acetylcysteine. Values in C are presented as percentages of initial beating frequency in C. Values are presented as means ± SE of 3 individual experiments with 3–4 clusters in each experiment and a total of 8–10 beating clusters in each group in B and C. aP < 0.01 and bP < 0.05. Scale bar: 100 µm.

