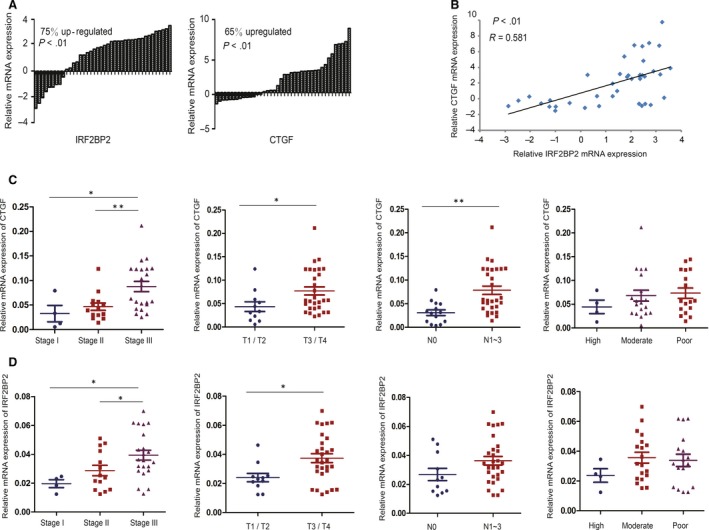
Figure 5.

Expression of IRF2BP2 and CTGF mRNA in fresh GC samples. A, The results of RT‐qPCR showed that the mRNA levels of IRF2BP2 and CTGF were higher in 40 fresh GC samples than in the paired adjacent normal tissues. B, IRF2BP2 mRNA levels were positively correlated with CTGF mRNA levels in these 40 samples. C, Relationship between CTGF mRNA expression and tumour stage or differentiation. D, Relationship between IRF2BP2 mRNA expression and tumour stage or differentiation. *P < .05, **P < .01. CTGF, connective tissue growth factor; GC, gastric cancer; IRF2BP2, interferon regulatory factor 2 binding protein 2
