Figure 2.
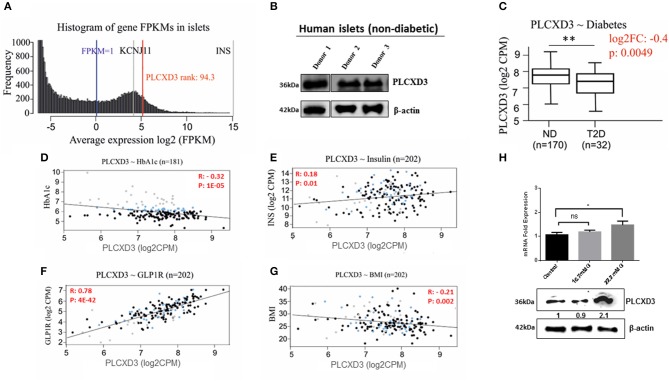
RNA sequencing expression of PLCXD3 in human islets. (A) Expression histogram of PLCXD3 obtained from non-diabetic human islets (n = 170) compared to KCNJ11 and INS genes. (B) Western blot expression analysis of PLCXD3 in human islets obtained from three different non-diabetic donors. (C) Expression level of PLCXD3 in diabetic islets (n = 32) vs. non-diabetic islets (n = 170). Correlation of RNA sequencing expression of PLCXD3 with (D) HbA1c levels, (E) insulin transcript, (F) GLP1R transcript, (G) and body mass index (BMI). (H) messenger RNA (mRNA) and protein expression analysis of PLCXD3 measured from cultured INS-1 (832/13) cells for 24 h at 16.7 mM glucose. The correlation coefficient (R) and p-value are indicated in the respective graphs (n = 192). *P < 0.05, **P < 0.01, and ***P < 0.001. Bars represent mean ± SEM.

