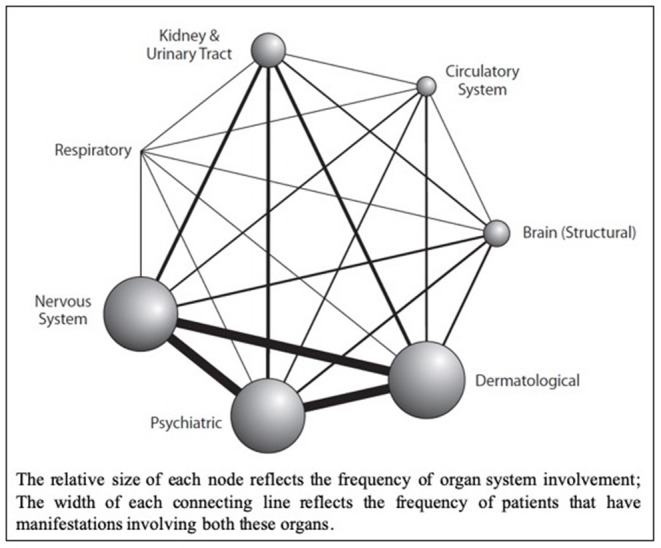
Figure 1.

Network Diagram showing primary organ systems affected for each patient from a retrospective cohort analysis of UK TSC patient data (n = 324); sourced from the Clinical Practice Research Datalink (CPRD), linked to secondary care data from Hospital Episode Statistics (HES) database, and the Office for National Statistics (ONS) mortality register (Reproduced with permission from Eur J Paediatr Neurol) (7).
