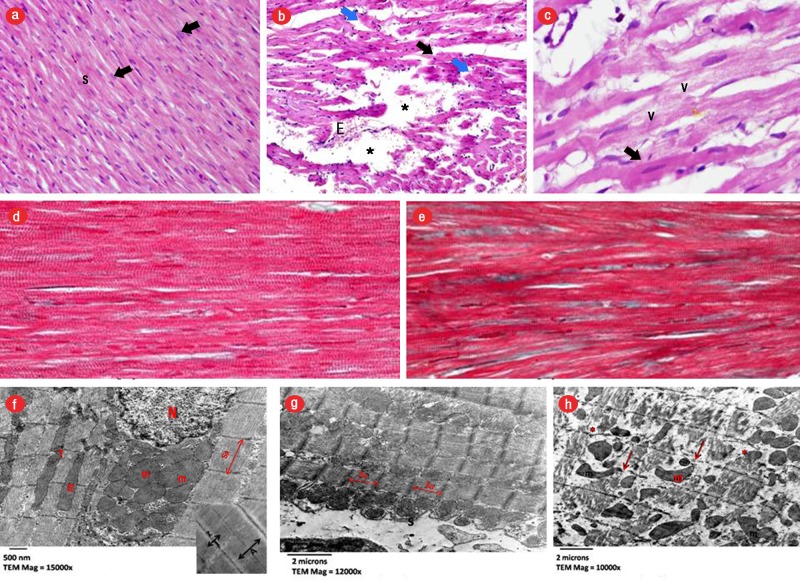
Figure 4.
Light micrographs stained by hematoxylin and eosin (H&E). (a) Control group (CG) showing longitudinally arranged fibers with acidophilic cytoplasm and central oval vesicular nuclei (arrows) with slit-like interstitial spaces (S), magnification = 400 ×. (b) AMI group showing wide-spaced thinned (black arrow), discontinued (blue arrow) and fragmented cardiomyocytes with areas of complete fiber loss (asterisks), extravasation of red blood cells, magnification = 400 ×. (c) Focal hypereosinophilic, homogeneous areas with loss of striation (thick arrow) with small dark nuclei. Vacuolated cardiomyocytes (v), magnification = 1000 ×. Masson’s trichrome-stained sections. (d) CG showing normal collagen fibers distribution in between the cardiomyocytes, magnification = 400 ×. (e) AMI group illustrating few collagen fibers in between the cardiomyocytes, magnification = 400 ×. Electron micrographs. (f) CG showing normal architecture of cardiomyocytes with well-ordered myofibrils and sarcomere (sa) and with a central vesicular nucleus (N) and normally arranged mitochondria (m), magnification = 15000 ×. Inset demonstrating alternating dark (A) and light (I) bands and regular Z lines (Z) bisecting I bands, magnification = 20000 ×. (g) AMI group showing markedly shortened and contracted sa, with approximated Z lines, marked scalloping and festooning of the sarcolemma (s), magnification = 12000 ×. (h) Interruption, fragmentation of cardiomyocytes with disturbed myocardial myofibrils pattern with patches of myocytolysis(*), variability of size, shape and abnormal orientation of mitochondria (m). Note, disturbed Z lines (arrows), magnification = 10000 ×.

