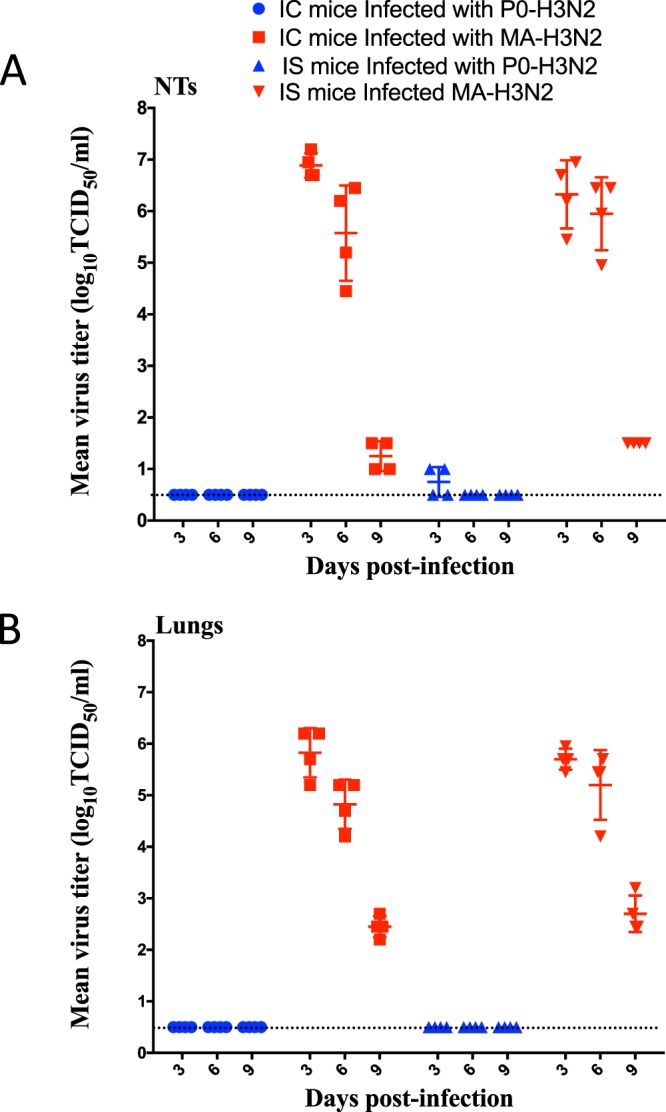
Figure 3.

Kinetics of replication of P0-H3N2 and MA-H3N2 viruses in IC and IS mice. Group of mice (n = 5) were intranasally infected with 1 × 10⁴ PFU/mouse. Virus titers in the nasal turbinates (A) and lungs (B) of 5 mice per group sacrificed on 3 and 6 dpi are expressed as log10 TCID50/mL of tissue. Horizontal bars represent mean titers and symbols represent titers from individual mice. The dashed horizontal line indicates the lower limit of detection.
