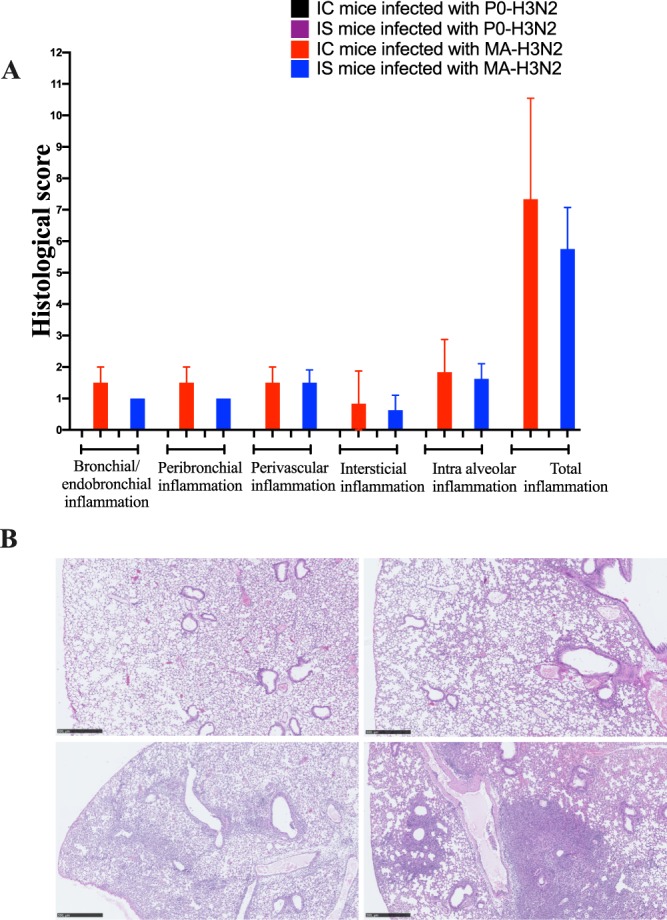
Figure 5.

Lung histopathology on day 6 post-infection in IC and IS C57BL/6 mice intranasally infected with 1 × 10⁴ PFU/mouse of P0-H3N2 and MA-H3N2 viruses. (A) Histological scores of IC and IS mice. (B) Pulmonary histology of IS mice infected with P0-H3N2 (upper left; inflammation score 0), IS mice infected with MA-H3N2 (lower left; inflammation score 7), IC mice infected with P0-H3N2 (upper right; inflammation score 0) and IC mice infected with MA-H3N2 (lower right; inflammation score 11). All photomicrographs are from 4 µm thick sections of formalin-fixed paraffin-embedded lung tissue stained with hematoxylin-eosin scanned with a Nanozoomer 2.0 (Hamamatsu, Japan). Micrometric scale of 500 µm.
