Figure 1.
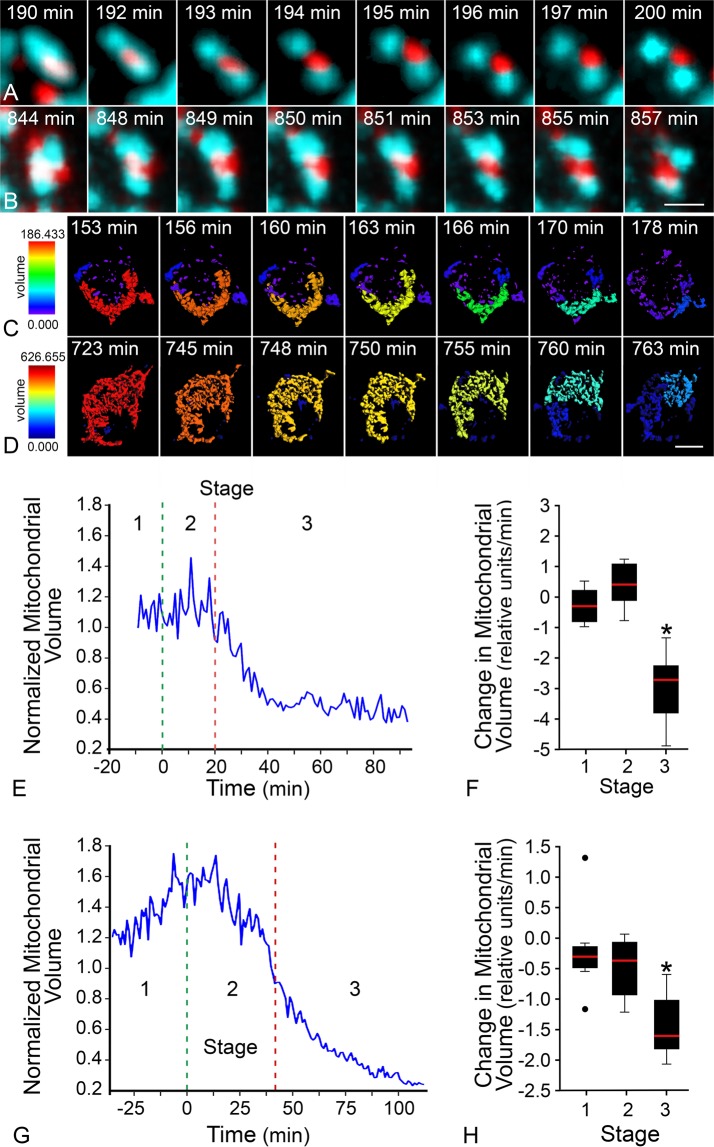
BAX recruitment completion coincides with rapid decline in mitochondrial volume. Mitochondrial fission occurs at the site of BAX recruitment. Images from a time-lapse video show recruited wild type mCherry-BAX at isolated mitochondria (mito-BFP, pseudo-colored teal) as the fission process completes in (A) a D407 cell and (B) a 661W cell. In these time series, the first and last image depicts a representative timepoint before and after fission, while the remaining images demonstrate the consecutive timeframes as the mitochondria are separating. Mitochondrial volume is graphically represented as a heat map of a 3-dimensional reconstruction of contiguous mitochondrial surfaces identified in a series of 20–25 optical sections. Red corresponds to reconstructions with the largest volume, and blue to the smallest. Images from time-lapse videos of color-coded mitochondria indicate volume changes at times after (C) staurosporine treatment in a D407 cell or (D) forced HDAC3 expression in a differentiated 661W cell (see also Video 1). Note that D407 cells have substantially smaller mitochondria than 661W cells prior to BAX recruitment. Representative graphs show the average (normalized) volume of mitochondria after an apoptotic stimulus within (E) a D407 cell or (G) a 661W cell. Each graph also depicts the average time of BAX recruitment initiation (green line) and BAX recruitment completion (red line) for that specific cell. The time between each of these distinctions creates three stages; Stages 1, 2, and 3, identifying 20 minutes before, during and 20 minutes after BAX recruitment. (F) D407 cells showed a Stage 1 rate of change of −0.29 ± 0.6 relative mitochondrial volume (RMV)/min, Stage 2 rate of 0.73 ± 1.2 RMV/min, and Stage 3 rate of −3.0 ± 1.2 RMV/min (n = 6 cells), (H) while 661W cells showed Stage 1 rate of change of −0.19 ± 0.8 RMV/min, Stage 2 rate of −0.50 ± 0.5 RMV/min, and Stage 3 rate of −1.45 ± 0.5 RMV/min (n = 4 cells). For both cell types, the rate of change of mitochondrial volume in Stage 2 was statistically similar to Stage 1 by a two-tailed t-test (D407 p = 0.28, 661W p = 0.45). The rate of change in Stage 3 was significantly faster than Stage 1 (D407, 661W *p < 0.05). Size bar = 500 nm (A,B), 3 µm (C,D)

