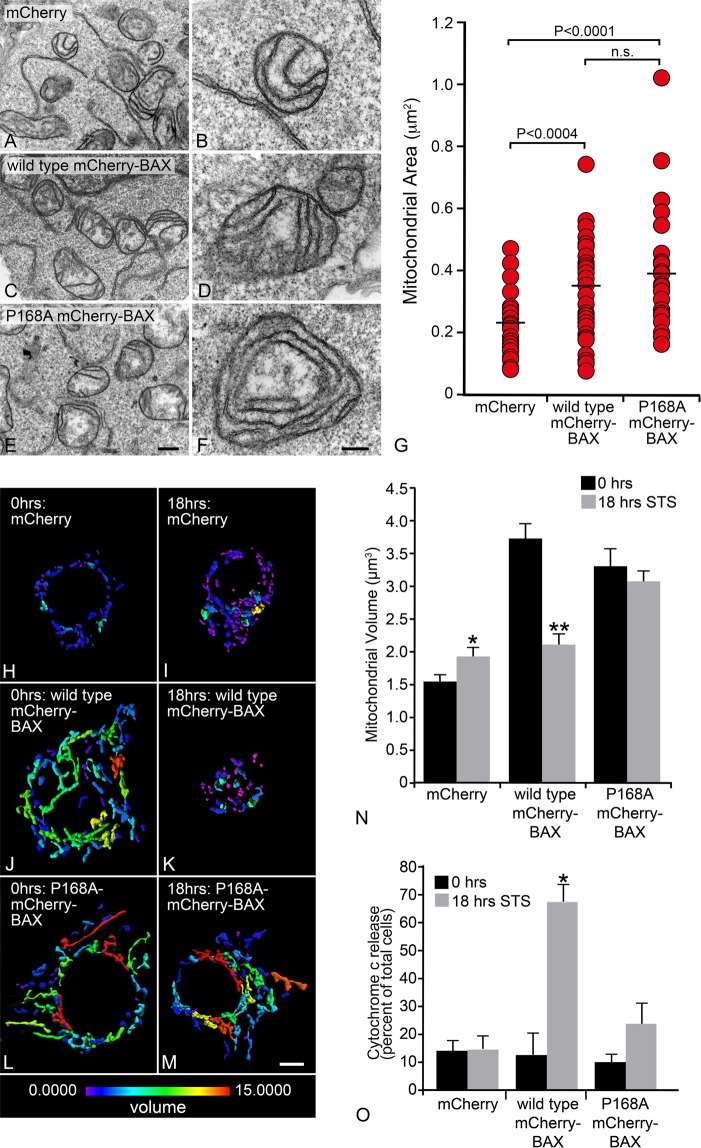
Figure 2.
The apoptotic function of BAX is required for mitochondrial fragmentation. Representative transmission electron microscope images of HCT116BAX−/−/BAK−/− cells expressing (A,B) mCherry, (C,D) wild type mCherry-BAX, or (E, F) P168A mCherry-BAX. All conditions exhibit intact double membranes and tubular cristae formation. (G) Mitochondrial area was calculated using ImageJ (v1.42q) on mitochondria exhibiting a circular cross section to eliminate sectioning bias. The average area for mCherry was 0.218 ± 0.016 (±s.e.m.), wild type mCherry-BAX was 0.327 ± 0.025, and P168A mCherry-BAX was 0.385 ± 0.030 µm2 (n ≥ 35 mitochondria per condition). Both wild type and P168A mCherry-BAX exhibited similar mitochondrial area (p = 0.134), which were each significantly greater when compared to mCherry alone (p < 0.004 and p < 0.0001, respectively). (A, C, E) Size bar = 1 µm. (B,D,F) Size bar = 200 nm. (H–M) Heat maps of mitochondrial volume are shown for representative cells, before and 18 hrs after staurosporine (STS) addition. A numerical based color-coded scale from 0 µm3 to 15 µm3 is shown at the bottom of the panels. Panels H and I show mCherry only control at 0 h and 18 hr after STS. Both conditions contain fragmented mitochondria and are primarily colored on the blue end of the volume spectrum. Panels J and K show wild type mCherry-BAX at 0 h with elongated mitochondria in the green to red spectrum, signifying larger volumes. With STS treatment, wild type mCherry-BAX shows mitochondrial fragmentation, exhibited by primarily blue colored objects. Panels L and M show P168A mCherry-BAX, which exhibits elongated mitochondria in the green to red spectrum in both conditions, demonstrating that P168A can rescue mitochondrial fusion in these cells (compare to H), but the process of mitochondrial fragmentation is impaired. Size bar = 5 µm. (N) A graph showing the mean mitochondrial volumes for each condition from three separate experiments (n = 30 cells per condition). For each cell analyzed, the average volume of all mitochondrial objects was used. The average volumes for mitochondria for each condition are as follows: mCherry alone (0 h) 1.6 ± 0.1 µm3 (±s.e.m.) and (18 h) 1.9 ± 0.1 µm3 (*p < 0.05), wild type mCherry-BAX (0 h) 3.7 ± 0.2 µm3 and (18 h) 2.1 ± 0.1 µm3 (**p < 1 × 10⁻⁷), and P168A mCherry-BAX (0 h) 3.3 ± 0.3 µm3 and (18 h) 3.1 ± 0.1 µm3 (p = 0.44). For mCherry (18 h) and wild type mCherry-BAX (18 h), (p = 0.36). For wild type mCherry-BAX (0 h) and P168A mCherry-BAX (0 h), (p = 0.23). The P168A BAX mutant also impairs cytochrome c release after STS addition. (O) A graph shows the percentage of total cells exhibiting the release of cytochrome c-GFP (based on diffuse localization in the cytoplasm, see supplemental Fig. S5). Each condition exhibits at least 85% of cells with cytochrome c-GFP localized to the mitochondria, except in wild type mCherry-BAX at 18 hours after STS addition, where the majority of cells (68%) show cytoplasmic localization of cytochrome c-GFP. There is no statistical difference between the percentage of cells that exhibit cytoplasmic cytochrome c-GFP localization at 0 and 18 hours in the mCherry condition (p = 0.93) or in the P168A mCherry-BAX condition (p = 0.06). There was a significant difference in the numbers of cells with cytoplasmic cytochrome c-GFP in the wild type mCherry-BAX condition after STS addition (*p < 0.0005). The total number of cells was counted from three separate experiments (n ≥ 125 cells per condition, except 18 hours wild type mCherry-BAX where n = 87 cells).

