Figure 3.
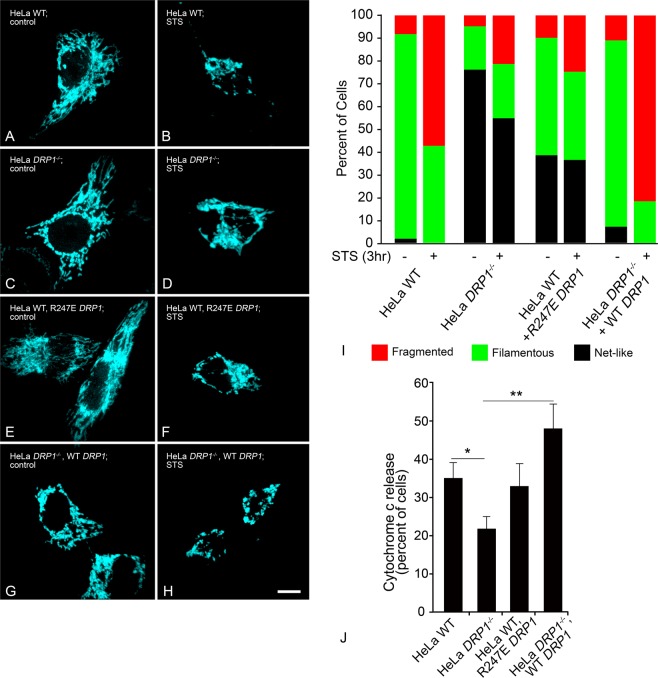
Deletion or expression of dominant negative DRP1 affects mitochondrial morphology. DRP1−/− cells, or expression of dominant negative mutant R247E DRP1 in wild type cells, affect the ability of mitochondria to execute fission. All cells were nucleofected with a plasmid carrying mito-BFP to visualize mitochondria. Mitochondrial morphologies are shown for (A,B) HeLa wild type (WT), (C,D) HeLaDRP1−/−, (E,F) WT HeLa + R247E DRP1, or (G,H) HeLaDRP1−/− + WT DRP1at (A,C,E,G) conditions prior to apoptosis induction, and (B,D,F,H) 3 h after addition of 1 µM staurosporine (STS), respectively. Induction of apoptosis execution was determined by presence of BAX puncta within the cell (not shown). Size bar = 5 µm. (I) Mitochondrial morphology was scored by a masked observer for a fragmented, filamentous, or a highly interconnected network-like appearance, before or after the addition of STS. WT cells exhibit predominantly filamentous mitochondria before STS addition, and highly fragmented mitochondria after (p < 0.0001, Chi Square test, n = 126 and 114 cells, respectively). DRP1−/− HeLa cells exhibit significantly more net-like mitochondria (p < 0.0001 relative to WT) prior to STS addition. STS induces a modest, but significant change in mitochondrial structure toward a fragmented appearance (p = 0.001, n = 144 and 123 cells, respectively). The expression of the dominant-negative R247E DRP1 mutant induces an intermediate phenotype for mitochondria, with a predominant mixture of filamentous and net-like structures that is significantly different from both WT cells (p < 0.0001) and DRP1−/− cells (p < 0.0001) prior to STS addition. The addition of STS promotes a shift toward fragmented mitochondria (p = 0.015, n = 81 and 81 cells, respectively). Expression of WT DRP1 in DRP1−/− cells reverts pre-STS mitochondrial morphology to a phenotype that is statistically similar to WT HeLa cells (p = 0.163), and the addition of STS is accompanied by a significant increase in mitochondrial fragmentation (p < 0.0001, n = 99 and 90 cells, respectively), that is even more pronounced than in WT cells (p < 0.001). (J) In a different set of experiments, we also examined the effect of DRP1 deficiency on the release of cytochrome c. Cells of the four different groups were nucleofected with cytochrome c-GFP, treated with STS, and then scored for cytosolic or mitochondrial cytochrome c-GFP. The graph shows the percentage of scored cells (mean ± s.e.m.) that exhibit the release of cytochrome c, 3 h after STS addition. Consistent with other reports, DRP1−/− cells exhibit retarded release of cytochrome c relative to both WT cells (*p < 0.01, t-test) or DRP1−/− cells expressing a WT DRP1 construct (**p < 0.0002). WT cells expressing the R247E mutant have an intermediate phenotype that is statistically similar to both WT and DRP1−/− cells (p = 0.693 and 0.095, respectively), similar to the mitochondrial morphology phenotype. Total cells scored, n = 232 (WT), 215 (DRP1−/−), 136 (WT cells + R247E DRP1), and 122 (DRP1−/− cells + WT DRP1).

