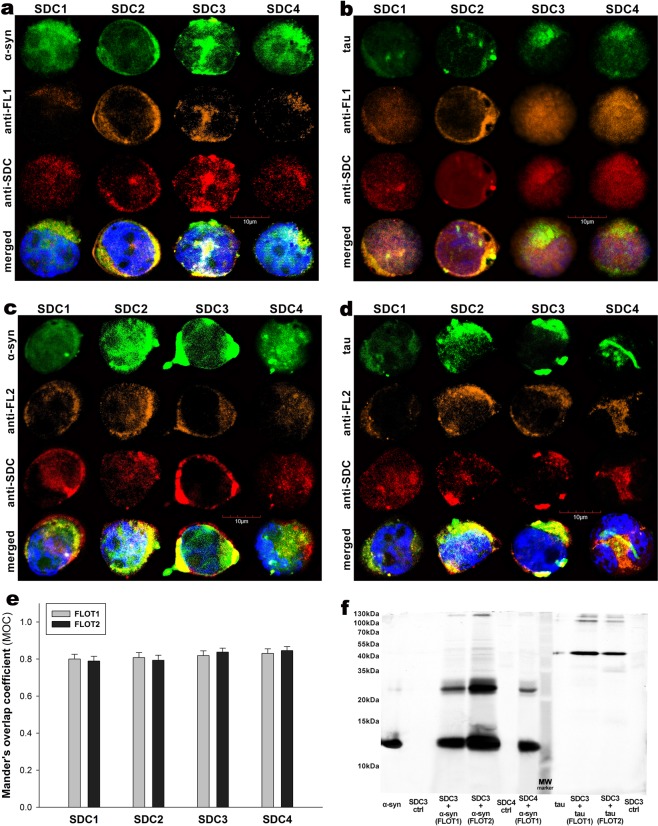
Figure 2.
Colocalization of α−syn and tau fibrils with SDCs and flotillins. SDC transfectants, treated with fluorescently labeled α−syn or tau fibrils (at a concentration of 5 µM monomer equivalent) for 3 h at 37 °C, were permeabilized and treated with the respective APC-labeled SDC antibodies, along with either flotillin 1 (FLOT1) or 2 (FLOT2) antibodies (both Alexa Fluor 546-labeled). Nuclei of cells were stained with DAPI and colocalization was then analyzed with CLSM. (a–d) CLSM images of SDC transfectants treated with either of the fluorescent fibrils (α−syn or tau), one of the flotillin antibodies (FLOT1 or 2) and a respective APC-labeled SDC antibody. Representative images of three independent experiments are shown (e) MOC ± SEM for the overlap of SDCs with either FLOT1 or FLOT2 was calculated by analyzing 21 cellular images (7 images per sample, experiments performed in triplicate). (f) SDS-PAGE showing fluorescent α−syn or tau immunoprecipitated with either of the flotillin antibodies from extracts of stable SDC3 and SDC4 transfectants. Fluorescent α−syn and tau were detected by Uvitec’s Alliance Q9 Advanced imaging platform. Lane 1: 0.5 ug of FITC-α−syn; Lane 2: immunoprecipitate of untreated SDC3 transfectants (controls); Lane 3–4: immunoprecipitate of FITC-α−syn-treated, stable SDC3 transfectants; Lane 5: immunoprecipitate of untreated SDC4 transfectants (controls) Lane 6: immunoprecipitate of FITC-α−syn-treated, stable SDC4 transfectants; Lane 7: Molecular weight (MW) marker; Lane 8: 0.5 ug of FITC-tau; Lane 9–10: immunoprecipitates of FITC-tau-treated stable SDC3 transfectants. Lane 11: immunoprecipitate of untreated SDC3 transfectants (controls). Standard protein size markers are indicated on the left.

